STAT225 Homework
advertisement
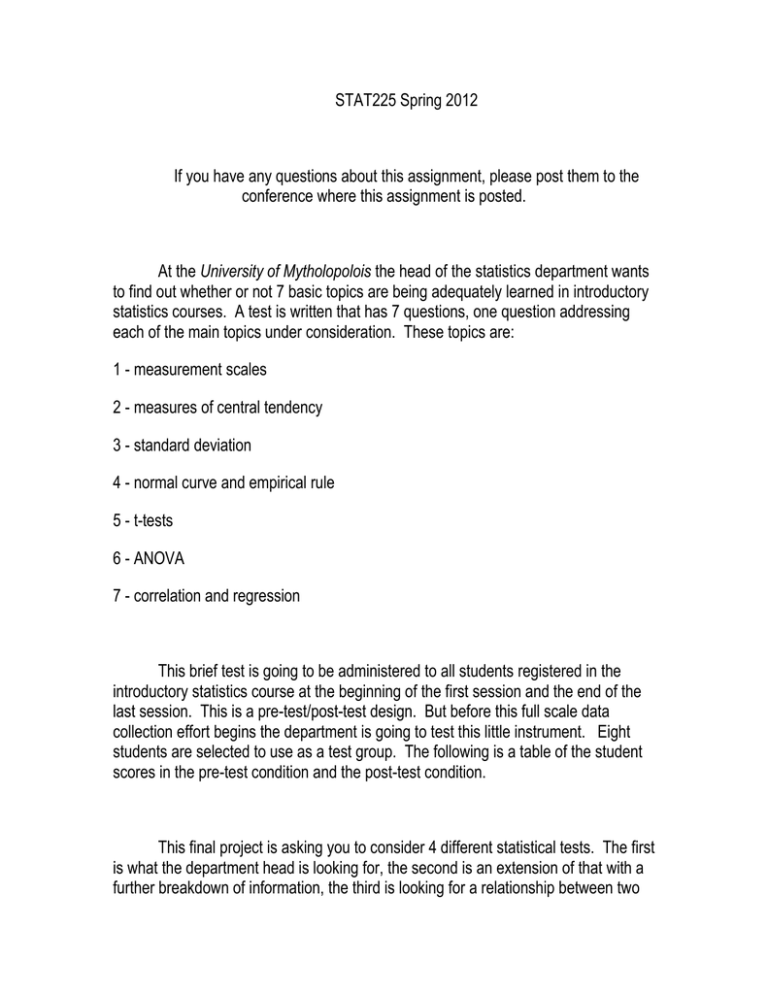
STAT225 Spring 2012 If you have any questions about this assignment, please post them to the conference where this assignment is posted. At the University of Mytholopolois the head of the statistics department wants to find out whether or not 7 basic topics are being adequately learned in introductory statistics courses. A test is written that has 7 questions, one question addressing each of the main topics under consideration. These topics are: 1 - measurement scales 2 - measures of central tendency 3 - standard deviation 4 - normal curve and empirical rule 5 - t-tests 6 - ANOVA 7 - correlation and regression This brief test is going to be administered to all students registered in the introductory statistics course at the beginning of the first session and the end of the last session. This is a pre-test/post-test design. But before this full scale data collection effort begins the department is going to test this little instrument. Eight students are selected to use as a test group. The following is a table of the student scores in the pre-test condition and the post-test condition. This final project is asking you to consider 4 different statistical tests. The first is what the department head is looking for, the second is an extension of that with a further breakdown of information, the third is looking for a relationship between two different variables and the fourth is asking what test you would use to predict a students score. Student Sex Pre-test Post-test Matilda Franklin Lily Paul Louise Golda Duncan Philip F M F M F F M M 4 2 4 3 5 4 2 6 6 5 7 6 5 6 5 7 Hours per week studying statistics 15 18 13 11 7 12 14 9 Answer the following questions about this problem. Preliminary information about the data (26 points): 1. What is the head of the statistics department trying to find out? 2. What are the variables of interest (there are three, make sure you describe each of them)? 3. What is the measurement scale of the each of the variables of interest (again, there are three)? 4. What is the mean of the pre-test scores? 5. What is the median of the post-test scores? 6. In both the pre and post test conditions, considering these as a single sample, what is the mode? (There should be 16 values considered.) 7. What is the range of the hours studied values? 8. Can you calculate a mean for the sex of the students involved in this pilot study? Explain your answer. 9. What is the standard deviation of the pre-test scores? (You don't have to do the standard deviation of the post-test scores.) First statistical test ( 50 points): 10. What statistical test are you going to use to find out whether there is a significant difference between the pre-test sample and the post-test sample? (Hint: see chapter 10) 11. Explain why this test is appropriate. 12. What is the null hypothesis? 13. What is the research hypothesis? 14. Perform the calculations for your proposed statistical test and show your work and your answer (there are 5 values I'm looking for here). 15. What is your observed value? 16. What are your degrees of freedom? 17. Is this a one-tailed or two-tailed test? 18. What table are you going to use to find your critical value? 19. What is your critical value? Your p value should be .05. 20. Based on your observed and critical values, is the difference between these two groups significant? 21. What conclusion can you draw from your result? State your conclusion in words, based on your null hypothesis. Second statistical test (14 points): In your first statistical test you tried to find out whether or not there was a difference between two groups test scores. What if we wanted to find out if there was a difference between the pre- and post- test scores broken down by sex? 22. How many groups are there for this analysis considering pre-test data, post-test data and sex? 23. What statistical test would propose to find out if there is a difference between these groups (think Chapter 12)? 24. What would your null hypothesis be for this additional analysis? 25. What would your research hypothesis be for this additional analysis? 26. What conclusion could you draw from that statistical test? 27. What conclusion can't you draw from this statistical test? 28. What additional statistical test do you need to perform in order to find out where the actual difference lies? Third statistical test (6 points): In your first and second statistical tests you were trying to find out whether there was a difference between the way TWO groups performed on the SAME variable. In this third scenario we want to find out whether there is a relationship between TWO different variables. 29. What statistical test do you propose to find out the relationship between posttest scores and the number of hours studied? 30. What can you conclude from this statistical test? 31. What can't you conclude from this statistical test? Fourth statistical test (2 points): Now, based on the result of the third test, we can conduct a further statistical test in order to see if we can make a suggestion to students about the number of hours they need to study in order to learn the most in their statistics course. 32. What statistical test can we use to predict the number of hours a student needs to study in order to do well in statistics?
