NTG 1.3 Graphs of Functions
advertisement
Name: ____________________________________
PreCalculus Notes Chapter 1 – Functions and Their Graphs
Date:___________________
1.3 The Graph of a Function
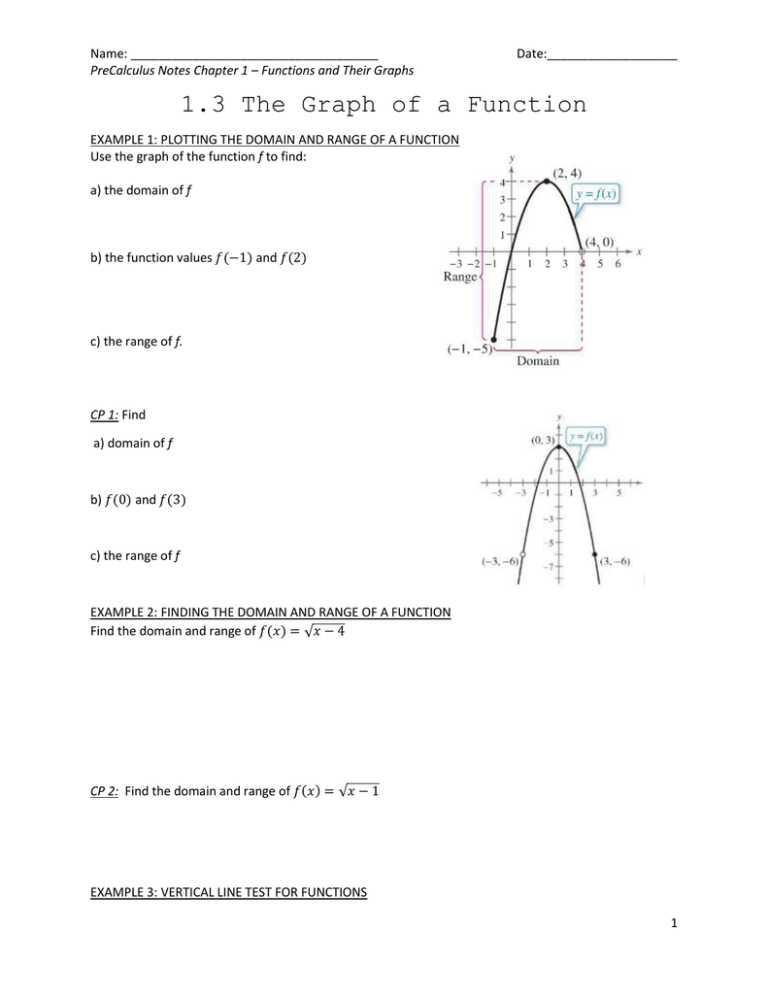
EXAMPLE 1: PLOTTING THE DOMAIN AND RANGE OF A FUNCTION
Use the graph of the function f to find:
a) the domain of f
b) the function values 𝑓(−1) and 𝑓(2)
c) the range of f.
CP 1: Find
a) domain of f
b) 𝑓(0) and 𝑓(3)
c) the range of f
EXAMPLE 2: FINDING THE DOMAIN AND RANGE OF A FUNCTION
Find the domain and range of 𝑓(𝑥) = √𝑥 − 4
CP 2: Find the domain and range of 𝑓(𝑥) = √𝑥 − 1
EXAMPLE 3: VERTICAL LINE TEST FOR FUNCTIONS
1
Name: ____________________________________
PreCalculus Notes Chapter 1 – Functions and Their Graphs
Date:___________________
Use the Vertical Line Test to decide whether each graph represents y as a function of x.
a)
b)
CP 3:
EXAMPLE 4: INCREASING AND DECREASING FUNCTIONS
Determine the open intervals on which the function is increasing, decreasing, or constant.
a)
b)
c)
CP 4: Graph the function𝑓(𝑥) = 𝑥 3 + 3𝑥 2 − 1. Then use the graph to describe the increasing and
decreasing behavior of the function.
2
Name: ____________________________________
PreCalculus Notes Chapter 1 – Functions and Their Graphs
Date:___________________
EXAMPLE 5: APPROXIMATING A RELATIVE MINIMUM
Use a graphing utility to approximate the relative minimum of the function 𝑓(𝑥) = 3𝑥 2 − 4𝑥 − 2
CP 5: Do the same for the function𝑓(𝑥) = 𝑥 3 + 3𝑥 2 − 1.
EXAMPLE 6: APPROXIMATING RELATIVE MINIMA AND MAXIMA
Use a graphing utility to approximate the relative maximum and relative minimum of the function
𝑓(𝑥) = −𝑥 3 + 𝑥.
CP 6: Do the same for 𝑓(𝑥) = 2𝑥 3 + 3𝑥 2 − 12𝑥
3
Name: ____________________________________
PreCalculus Notes Chapter 1 – Functions and Their Graphs
Date:___________________
EXAMPLE 7: TEMPERATURE
During a 24-hour period, the temperature y (n degrees Fahrenheit) of a certain city can be approximated
by the model
𝑦 = 0.026𝑥 3 − 1.03𝑥 2 + 10.2𝑥 + 34, 0 ≤ 𝑥 ≤ 24
Where x represents the time of day, with 𝑥 = 0 corresponding to 6 a.m. Approximate the maximum
temperature during this 24-hour period.
CP 7: In EX7, approximate the minimum temperature during the 24-hour period.
EXAMPLE 8: SKETCHING A PIECEWISE-DEFINED FUNCTION
2𝑥 + 3, 𝑥 ≤ 1
Sketch the graph of 𝑓(𝑥) = {
by hand.
−𝑥 + 4, 𝑥 > 1
1
− 𝑥−6,
CP8: Sketch 𝑓(𝑥) = { 2
𝑥 + 5,
𝑥 ≤ −4
𝑥 > −4
4
Name: ____________________________________
PreCalculus Notes Chapter 1 – Functions and Their Graphs
Date:___________________
EXAMPLE 9: EVEN AND ODD FUNCTIONS
For each graph, determine whether the function is even, odd, or neither.
a)
b)
c)
d)
CP9: Use a graphing utility to graph 𝑓(𝑥) = 𝑥 2 − 4 and determine whether it is odd, even, or neither.
Test for even and odd functions:
EXAMPLE 10: EVEN AND ODD FUNCTIONS
5
Name: ____________________________________
PreCalculus Notes Chapter 1 – Functions and Their Graphs
Date:___________________
Determine whether each function is even, odd, or neither.
a) 𝑔(𝑥) = 𝑥 3 − 𝑥
b) 𝑥 2 + 1
c) 𝑥 3 − 1
CP10: Even, odd, or neither?
a) 𝑓(𝑥) = 5 − 3𝑥
c) 2𝑥 3 + 3𝑥
b) 𝑓(𝑥) = 𝑥 4 − 𝑥 2 − 1
6

