1.2 Graphing Utilities and Complete Graphs x
advertisement

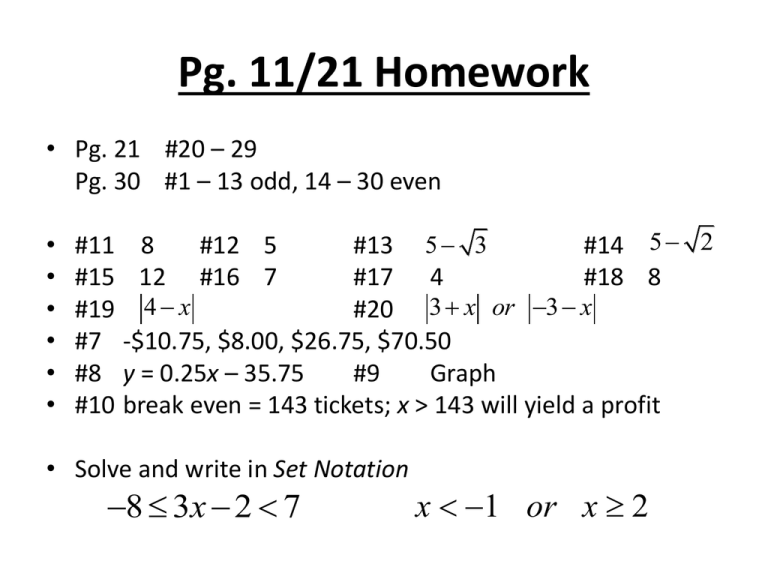
Pg. 11/21 Homework • Pg. 21 #20 – 29 Pg. 30 #1 – 13 odd, 14 – 30 even • • • • • • #11 8 #12 5 #13 5 3 #14 5 2 #15 12 #16 7 #17 4 #18 8 #19 4 x #20 3 x or 3 x #7 -$10.75, $8.00, $26.75, $70.50 #8 y = 0.25x – 35.75 #9 Graph #10 break even = 143 tickets; x > 143 will yield a profit • Solve and write in Set Notation 8 3x 2 7 x 1 or x 2 1.2 Graphing Utilities and Complete Graphs Problem Solving • Read the problem • Re-read the problem • State the problem in your own words • Define the variables in the problem • Clearly identify what you are given and what you are looking for Example • It costs $8 to enter the fair. Each ticket towards a ride costs $0.75. • Generalize the pattern from the given information. 1.2 Graphing Utilities and Complete Graphs Looking at Your Information • The roller coaster requires 6 tickets to ride. How much money total will you spend to ride the roller coaster twice? • You only have $20. You want to ride the Tilt-a Whirl twice and roller coaster once. If the Tilt-a Whirl requires 5 tickets. Will you have any money left over for cotton candy? 1.2 Graphing Utilities and Complete Graphs Table of Values/Data Pairs Graph 1.2 Graphing Utilities and Complete Graphs Proper Windows • Find a proper window for: y x 2 10 y x 20 Sketches of Complete Graphs • Must contain all data from a given table • Must suggest a pattern from the table • The equation must model the data for every point in the table • This gives one possible complete graph through the points in the given table 1.2 Graphing Utilities and Complete Graphs x -3 -2.5 -2 -1.5 -1 -0.5 0 0.5 1 1.5 2 2.5 3 y -15 -5.625 0 2.625 3 1.875 0 -1.875 -3 -2.625 0 5.625 15 y x3 4 x 1.3 Functions Functions • A function of x is a correspondence that associates each x in a set X with exactly one y in a set Y. – If x is the input value and y is the output value we call y the image of x under f. • For all functions: y f x • All functions must pass the VLT!! • Functions can be graphed • Functions are equations in two variables • All functions have a domain and range 1.3 Functions Function Values • Find the function values f x x 2 3x f 2 f x 1 Are the following functions? 1.3 Functions y x2 4 y x2 4 • Graph the function • Graph the function • Find the domain and range • Find the domain and range 1.3 Functions Determine the domain and range. Use a grapher if necessary. y x2 x y x 1 5 y x 1 y 1 x


