AP Psychology Name_______________________ Statistics
advertisement
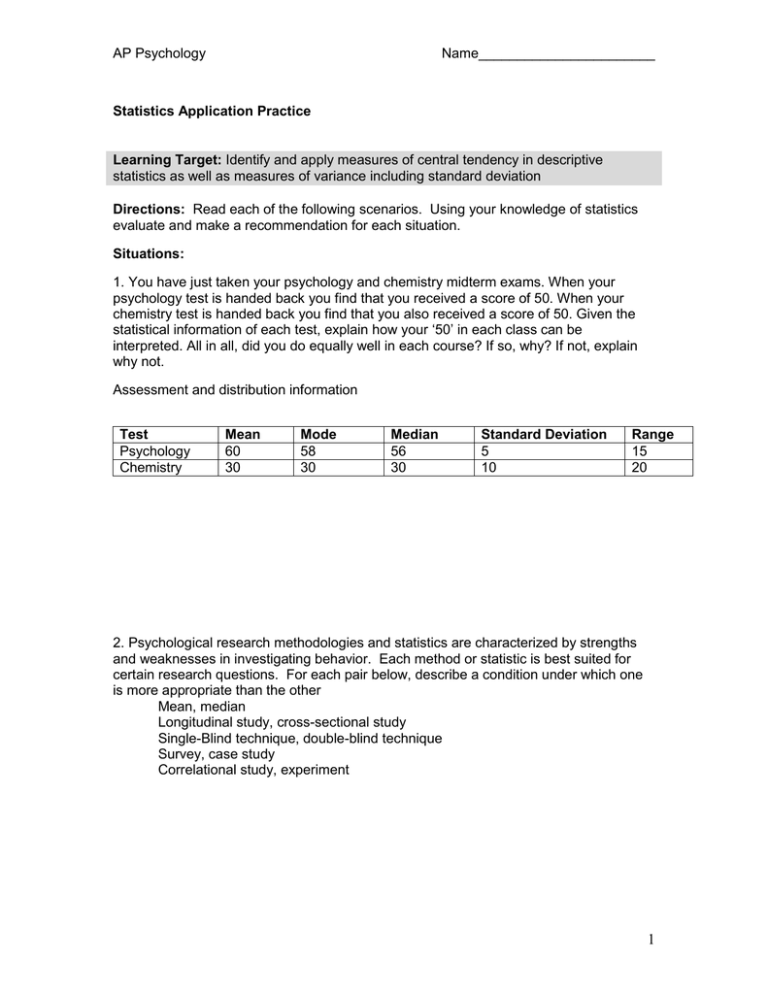
AP Psychology Name_______________________ Statistics Application Practice Learning Target: Identify and apply measures of central tendency in descriptive statistics as well as measures of variance including standard deviation Directions: Read each of the following scenarios. Using your knowledge of statistics evaluate and make a recommendation for each situation. Situations: 1. You have just taken your psychology and chemistry midterm exams. When your psychology test is handed back you find that you received a score of 50. When your chemistry test is handed back you find that you also received a score of 50. Given the statistical information of each test, explain how your ‘50’ in each class can be interpreted. All in all, did you do equally well in each course? If so, why? If not, explain why not. Assessment and distribution information Test Psychology Chemistry Mean 60 30 Mode 58 30 Median 56 30 Standard Deviation 5 10 Range 15 20 2. Psychological research methodologies and statistics are characterized by strengths and weaknesses in investigating behavior. Each method or statistic is best suited for certain research questions. For each pair below, describe a condition under which one is more appropriate than the other Mean, median Longitudinal study, cross-sectional study Single-Blind technique, double-blind technique Survey, case study Correlational study, experiment 1 AP Psychology Name_______________________ 3. Dr. Weindenbach wants to know in general how well the students are doing in his class. He also wants to know whether the students in his class are performing differently as compared to each other on exams or if they are all generally performing similarly. He knows that there is some variability in any class, but he suspects that this one is more than 3 points (the equivalent of 2 letters grades on his 15 point quiz). He will create a weekly study session for his students who are more than. He takes data from the first exam of the semester, which is recorded below. Please compute the data and advise Dr. Weindenbach on who should attend his study sessions (those who are more than two standard deviations away from the mean on two or more quizzes). Quiz Scores from class Student Number 1 Quiz #1 Score 7 Quiz #2 Score 6 Quiz #3 Score 5 2 9 12 11 3 9 11 11 4 10 8 10 5 10 12 12 6 11 6 11 7 11 11 13 8 13 14 15 Calculate the Measures of Central Tendency: Quiz #1 Quiz #2 Quiz #3 Range Mean Mode Median Variance Standard Deviation Recommendation: (Which students should attend the study session?). Explain your recommendation 2

