Calculator Hints
advertisement

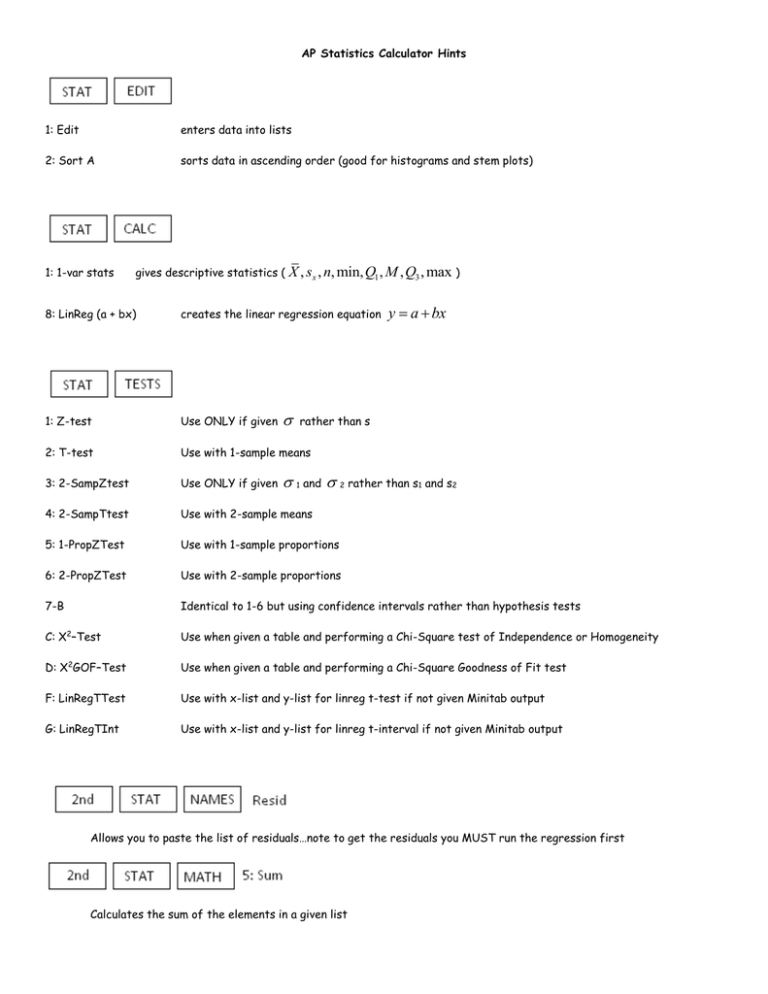
AP Statistics Calculator Hints 1: Edit enters data into lists 2: Sort A sorts data in ascending order (good for histograms and stem plots) 1: 1-var stats gives descriptive statistics ( X , sx , n, min, Q1 , M , Q3 , max ) y a bx 8: LinReg (a + bx) creates the linear regression equation 1: Z-test Use ONLY if given 2: T-test Use with 1-sample means 3: 2-SampZtest Use ONLY if given 4: 2-SampTtest Use with 2-sample means 5: 1-PropZTest Use with 1-sample proportions 6: 2-PropZTest Use with 2-sample proportions 7-B Identical to 1-6 but using confidence intervals rather than hypothesis tests C: X2–Test Use when given a table and performing a Chi-Square test of Independence or Homogeneity D: X2GOF–Test Use when given a table and performing a Chi-Square Goodness of Fit test F: LinRegTTest Use with x-list and y-list for linreg t-test if not given Minitab output G: LinRegTInt Use with x-list and y-list for linreg t-interval if not given Minitab output rather than s 1 and 2 rather than s1 and s2 Allows you to paste the list of residuals…note to get the residuals you MUST run the regression first Calculates the sum of the elements in a given list Allows you to paste y a bx 2: normalcdf IF start in the y= list and have already separately calculated the regression equation Calculates the probability for a certain region (area underneath a curve); type in (left boundary, right boundary) 3: invNorm Finds the z-score for a particular percentile; type in (proportion to the left of your boundary) 4: invT Finds the t-score for a particular percentile or t* (upper critical value) for confidence intervals involving the t-distribution; type in (proportion to the left of your boundary, degrees of freedom) 6: tcdf Calculates the probability for a certain region (area underneath a curve) for a t-distribution; type in (left boundary, right boundary, degrees of freedom) 8: χ2cdf Calculates the probability for a certain region (area underneath a curve) for a χ2-distribution; type in (χ2, right boundary…try 1000, degrees of freedom) 0: binompdf Calculates binomial theorem probability for P(X = k); type in (n, p, k) 1: binomcdf Calculates binomial theorem probability for P(X≤ k); type in (n, p, k) where k is the largest value of X E: geometpdf Calculates geometric probability for P(X = n); type in (p, n) F: geometcdf Calculates geometric probability for P(X ≤ n); type in (p, n) where n is the largest value of X Calculates inverse log (good when working with exponential data) 1: Plot 1 Turn it on (enter takes you to the next menu) 6 graphs follow Row 1: Scatterplot, Time Plot, Histogram Row 2: Modified Box Plot, Box Plot, Normal Probability Plot (Normal Probability Plot, aka Normal Quantile Plot, is useful when asked if your data are normally distributed…enter the list number for your data…if this graph is linear, then your 9: Zoom Stat x-values are normally distributed.) takes you to a nice window for statistics Scroll to DiagnosticOn (turns on values such as r, r2 if your calculator is cleared)


