AP Statistics Chapter 2 Schedule
advertisement

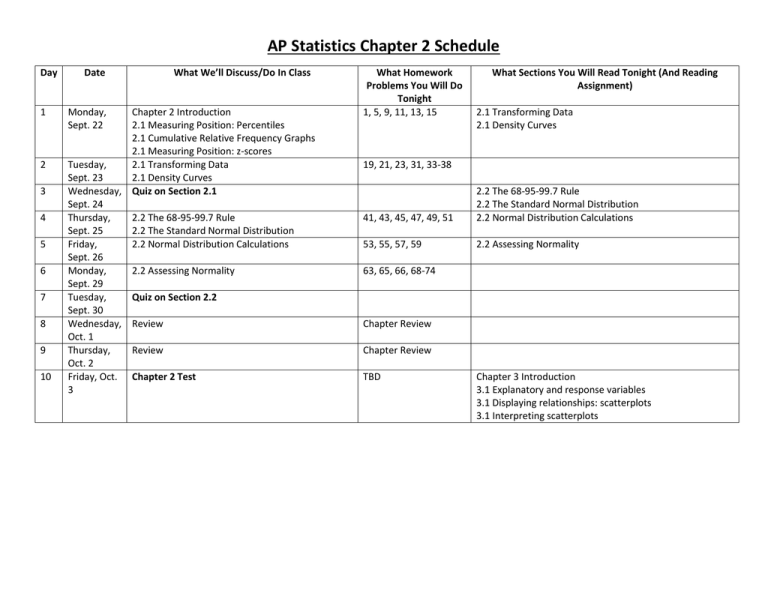
AP Statistics Chapter 2 Schedule Day 1 2 3 4 5 6 7 8 9 10 Date Monday, Sept. 22 What We’ll Discuss/Do In Class Chapter 2 Introduction 2.1 Measuring Position: Percentiles 2.1 Cumulative Relative Frequency Graphs 2.1 Measuring Position: z-scores Tuesday, 2.1 Transforming Data Sept. 23 2.1 Density Curves Wednesday, Quiz on Section 2.1 Sept. 24 Thursday, 2.2 The 68-95-99.7 Rule Sept. 25 2.2 The Standard Normal Distribution Friday, 2.2 Normal Distribution Calculations Sept. 26 Monday, 2.2 Assessing Normality Sept. 29 Tuesday, Quiz on Section 2.2 Sept. 30 Wednesday, Review Oct. 1 Thursday, Review Oct. 2 Friday, Oct. Chapter 2 Test 3 What Homework Problems You Will Do Tonight 1, 5, 9, 11, 13, 15 What Sections You Will Read Tonight (And Reading Assignment) 2.1 Transforming Data 2.1 Density Curves 19, 21, 23, 31, 33-38 41, 43, 45, 47, 49, 51 2.2 The 68-95-99.7 Rule 2.2 The Standard Normal Distribution 2.2 Normal Distribution Calculations 53, 55, 57, 59 2.2 Assessing Normality 63, 65, 66, 68-74 Chapter Review Chapter Review TBD Chapter 3 Introduction 3.1 Explanatory and response variables 3.1 Displaying relationships: scatterplots 3.1 Interpreting scatterplots Learning Targets: Use percentiles to locate individual values within distributions of data. Interpret a cumulative relative frequency graph. Find the standardized value (z-score) of an observation. Interpret z-scores in context. Describe the effect of adding, subtracting, multiplying by, or dividing by a constant on the shape, center, and spread of a distribution of data. Approximately locate the median (equal-areas point) and the mean (balance point) on a density curve. Use the 68-95-99.7 rule to estimate the percent of observations from a normal distribution that fall in an interval involving points one, two, or three standard deviations on either side of the mean. Use the standard normal distribution to calculate the proportion of values in a specified interval. Use the standard normal distribution to determine a z-score from a percentile. Use Table A to find the percentile of a value from any normal distribution and the value that corresponds to a given percentile. Make an appropriate graph to determine whether a distribution is bell-shaped. Use the 68-95-99.7 rule to assess normality of a data set. Interpret a normal probability plot.


