AP STATISTICS: Ms Jetmore 2015
advertisement

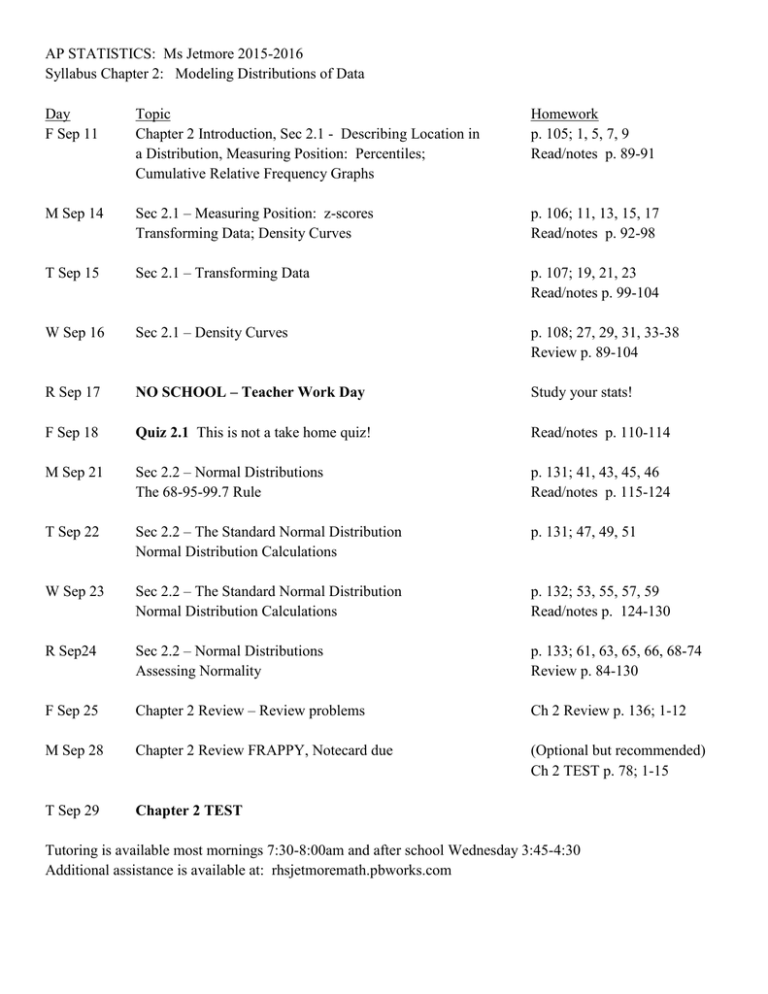
AP STATISTICS: Ms Jetmore 2015-2016 Syllabus Chapter 2: Modeling Distributions of Data Day F Sep 11 Topic Chapter 2 Introduction, Sec 2.1 - Describing Location in a Distribution, Measuring Position: Percentiles; Cumulative Relative Frequency Graphs Homework p. 105; 1, 5, 7, 9 Read/notes p. 89-91 M Sep 14 Sec 2.1 – Measuring Position: z-scores Transforming Data; Density Curves p. 106; 11, 13, 15, 17 Read/notes p. 92-98 T Sep 15 Sec 2.1 – Transforming Data p. 107; 19, 21, 23 Read/notes p. 99-104 W Sep 16 Sec 2.1 – Density Curves p. 108; 27, 29, 31, 33-38 Review p. 89-104 R Sep 17 NO SCHOOL – Teacher Work Day Study your stats! F Sep 18 Quiz 2.1 This is not a take home quiz! Read/notes p. 110-114 M Sep 21 Sec 2.2 – Normal Distributions The 68-95-99.7 Rule p. 131; 41, 43, 45, 46 Read/notes p. 115-124 T Sep 22 Sec 2.2 – The Standard Normal Distribution Normal Distribution Calculations p. 131; 47, 49, 51 W Sep 23 Sec 2.2 – The Standard Normal Distribution Normal Distribution Calculations p. 132; 53, 55, 57, 59 Read/notes p. 124-130 R Sep24 Sec 2.2 – Normal Distributions Assessing Normality p. 133; 61, 63, 65, 66, 68-74 Review p. 84-130 F Sep 25 Chapter 2 Review – Review problems Ch 2 Review p. 136; 1-12 M Sep 28 Chapter 2 Review FRAPPY, Notecard due (Optional but recommended) Ch 2 TEST p. 78; 1-15 T Sep 29 Chapter 2 TEST Tutoring is available most mornings 7:30-8:00am and after school Wednesday 3:45-4:30 Additional assistance is available at: rhsjetmoremath.pbworks.com Chapter Objectives Section 2.1 – Describing Location in a Distribution Use percentiles to locate individual values within distributions of data. Interpret a cumulative relative frequency graph. Find the standardized value (z-score) of an observation. Interpret z-scores in context. Describe the effect of adding, subtracting, multiplying by, or dividing by a constant on the shape, center, and spread of a distribution of data. Approximately locate the median (equal-areas point) and the mean (balance point) on a density curve. Section 2.2 – Normal Distributions Use the 68-95-99.7 rule to estimate the percent of observations from a Normal distribution that fall in an interval involving points one, two, or three standard deviations on either side of the mean. Use the standard Normal distribution to calculate the proportion of values in a specified interval. Use the standard Normal distribution to determine a z-score from a percentile. Use Table A to find the percentile of a value from any Normal distribution and the value that corresponds to a given percentile. Make an appropriate graph to determine if a distribution is bell-shaped. Use the 68-95-99.7 rule to assess Normality of a data set. Interpret a Normal probability plot. AP Exam Tips Don’t use “calculator speak” when showing your work on free-response questions. Writing normalcdf (305,325,304,8) will not earn you credit for a Normal calculation. At the very least, you must indicate what each of those calculator inputs represents. For example, “I used normalcdf on my calculator with lower bound 305, upper bound 325, mean 304, and standard deviation 8.” Better yet, sketch and label a Normal curve to show what you’re finding. Normal probability plots are not included on the AP Statistics course outline. However, these graphs are very useful tools for assessing Normality. You may use them on the AP exam if you wish – just be sure that you know what you’re looking for (linear pattern). Free-Response Questions from Previous AP Exams Questions can be found on the AP Central Web site: http://apcentral.collegeboard.com/apc/members/exam/exam_questions/8357.html. Students should be able to answer all the free-response questions listed with material in this chapter. Questions that contain content from this chapter but also require content from later chapters are listed in the last chapter required to complete the entire question. Some of these problems we will do in class as warm-up problems. You may do the others to help you understand the content from this chapter as well as to prepare for the AP exam in May. Year 2011 Question 1 2009B 1 2008 1 2006B 1997 1 1 Content Assessing normality from summary statistics, Calculating and interpreting a z-score, using z-scores to make a comparison Estimating median and IQR from a boxplot, linear transformations of data Comparing distributions with boxplots, linear transformations of data, effect of shape on the relationship between mean and median Interpreting cumulative relative frequency graphs Interpreting cumulative relative frequency graphs, finding the median and IQR from a cumulative relative frequency graph, comparing center and spread


