Supplementary File 1 – Appendix
advertisement
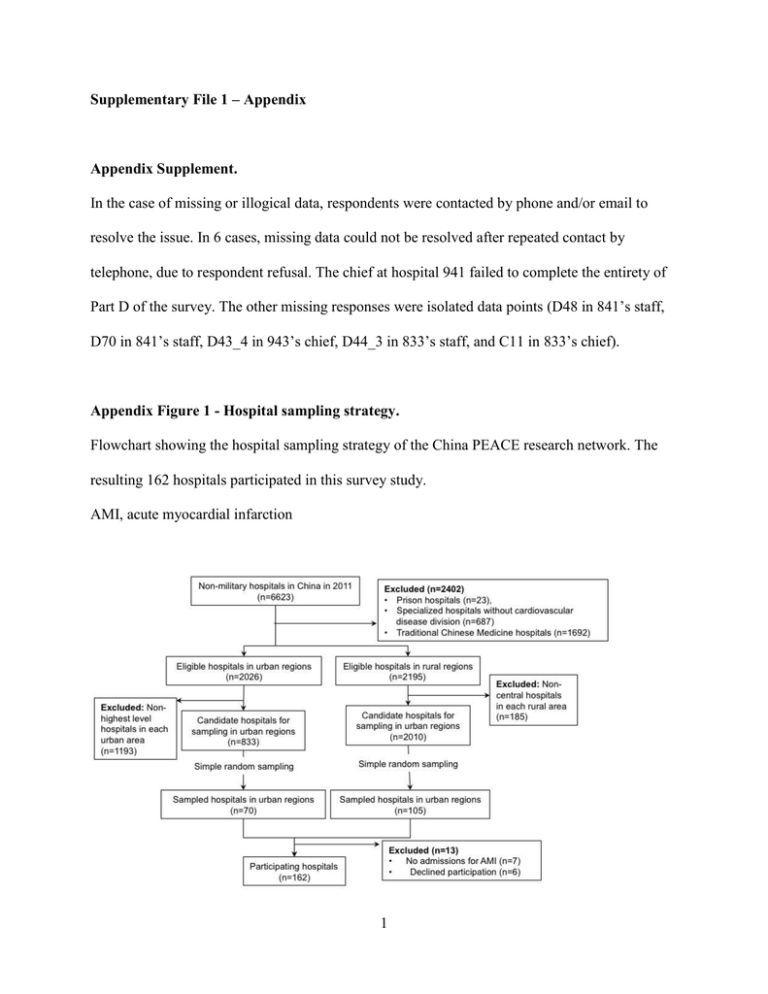
Supplementary File 1 – Appendix Appendix Supplement. In the case of missing or illogical data, respondents were contacted by phone and/or email to resolve the issue. In 6 cases, missing data could not be resolved after repeated contact by telephone, due to respondent refusal. The chief at hospital 941 failed to complete the entirety of Part D of the survey. The other missing responses were isolated data points (D48 in 841’s staff, D70 in 841’s staff, D43_4 in 943’s chief, D44_3 in 833’s staff, and C11 in 833’s chief). Appendix Figure 1 - Hospital sampling strategy. Flowchart showing the hospital sampling strategy of the China PEACE research network. The resulting 162 hospitals participated in this survey study. AMI, acute myocardial infarction 1 Appendix Figure 2 - Breakdown of responses per question by domain. Percentage of participants (y-axis) providing a given response (x-axis) for each survey question. Questions are grouped by organizational learning domain as defined by the LOS-27. The responses from all 317 survey respondents are represented, including those of the 1 respondent who failed to complete Part D of the survey. LOS, Learning Organization Survey 2 3 4 Appendix Table 1 – Learning Organization Survey (LOS) domains. The LOS-27 is composed of 7 domains of organizational learning: supportive learning environment; time for reflection; leadership that reinforces learning; experimentation; training; knowledge acquisition; and performance monitoring.[1] These domains were derived from three “building blocks” and nine sub-domains outlined by Garvin et al.[2] To reduce redundancy and enhance validity in a healthcare setting, questions were re-distributed into 7 domains using exploratory factor analysis. Question responses were scaled from 1-7 (Highly inaccurate, Inaccurate, Somewhat inaccurate, Neither accurate nor inaccurate, Somewhat accurate, Accurate, Highly accurate) or 1-5 (Never, Rarely, Sometimes, Usually, Always). Characteristics Question Example (scale) Members: This workgroup engages in productive conflict and Supportive learning Are comfortable with raising disagreements debate during discussions. (1-7) environment Feel safe admitting to mistakes Appreciate opposing ideas Time for reflection Members: There is simply no time for reflection in this Have sufficient time to reflect workgroup. (1-7) Have time to invest in improvement 5 Leadership that reinforces learning Experimentation Training Leaders: My manager(s) establish(es) forums for and Allow for input and discussion provide(s) time and resources for reflecting and Provide structured means for identifying problems improving on past performance. (1-7) The workgroup: This workgroup frequently employs pilot projects or Experiments with new ideas or methods simulations when trying our new ideas. (1-7) New employees receive adequate training Experienced employees in this workgroup receive Experienced employees continue to receive training training when shifting to a new position. (1-7) regularly or when new skills are necessary Knowledge acquisition Performance monitoring The team has formal processes for: This workgroup has forums for meeting with and Sharing information learning from: Experts from outside the organization. Acquiring information from experts and customers (1-7) The team has formal processes for: This workgroup frequently compares its performance Gathering and interpreting outside information to: Best-in-class organizations. (1-7) Monitoring technological trends 6 Appendix Table 2 - Overall PRR by domain and hospital level factors. Indicates values of: Median (IQR) [Range]. P-values are shown for chi-squared tests between domain positive response rates (PRRs) by hospital-level factors. Domains are abbreviated as follows: SLE = Supportive learning environment; TFR = Time for reflection; LRL = Leadership that reinforces learning; E = Experimentation; T = Training; KA = Knowledge acquisition; PM = Performance monitoring. n All hospitals All domains SLE TFR LRL E T KA PM 81.5% 85.7% 50.0% 100.0% 75.0% 100.0% 75.0% 100.0% (59.3%- (71.4%- (0.0%- (25.0%- (25.0%- (66.7%- (50.0%- (66.7%- 92.6%) 100%) 100%) 100%) 100%) 100%) 100%) 100%) [9.3%-100%] [0%-100%] [0%-100%] [0%-100%] [0%-100%] [0%-100%] [0%-100%] [0%-100%] 85.2% 85.7% 100.0% 100.0% 75.0% 100.0% 75.0% 100.0% (70.4%- (71.4%- (50.0%- (25.0%- (50.0%- (66.7%- (50.0%- (100%- 92.6%) 100%) 100%) 100%) 100%) 100%) 100%) 100%) 74.1% 85.7% 50.0% 75.0% 75.0% 100.0% 75.0% 100.0% (55.6%- (71.4%- (0.0%- (25.0%- (25.0%- (66.7%- (25.0%- (66.7%- 162 Urban/rural Urban Rural 63 99 7 88.9%) 100%) 100%) 100%) 100%) 100%) 100%) 100%) Chi-square – 5.7024 3.0186 3.6657 1.5580 2.8506 1.9870 2.6854 8.0059 P-value – 0.0169 0.0823 0.0555 0.2120 0.0913 0.1587 0.1013 0.0047 85.2% 85.7% 100.0% 100.0% 75.0% 100.0% (70.4%- (71.4%- (50.0%- (50.0%- (75.0%- (100%- 96.3%) 100%) 100%) 100%) 100%) 100%) 75.9% 85.7% 50.0% 100.0% 75.0% 100.0% 75.0% 66.7% (55.6%- (71.4%- (0.0%- (31.3%- (25.0%- (66.7%- (25.0%- (100%- 88.9%) 85.7%) 100%) 100%) 100%) 100%) 100%) 100%) 68.5% 85.7% 50.0% 62.5% 75.0% 100.0% 75.0% 100.0% (47.2%- (57.1%- (0.0%- (25.0%- (25.0%- (33.3%- (18.8%- (33.3%- 85.2%) 89.3%) 100%) 100%) 100%) 100%) 100%) 100%) Region 75.0% Eastern 64 100.0% (50%-100%) (100%-100%) Central Western 48 50 Chi-square – 13.5898 8.8835 4.5520 6.7235 5.3276 6.7870 7.3740 8.9147 P-value – 0.0011 0.0118 0.1027 0.0347 0.0697 0.0336 0.0250 0.0116 Hospital level 8 74.1% 85.7% 50.0% 75.0% 75.0% 100.0% 75.0% 100.0% (55.6%- (71.4%- (0.0%- (25.0%- (25.0%- (66.7%- (25.0%- (66.7%- 88.9%) 100%) 100%) 100%) 100%) 100%) 100%) 100%) 85.2% 85.7% 100.0% 100.0% 75.0% 75.0% 100.0% (66.7%- (71.4%- (0.0%- (25.0%- (50.0%- (50.0%- (100%- 94.5%) 100%) 100%) 100%) 100%) 100%) 100%) Secondary or 97 below 100.0% Tertiary 65 (100%-100%) Chi-square – 6.4749 2.3891 2.2473 1.5830 2.6036 4.1234 2.5816 7.0312 P-value – 0.0109 0.1222 0.1338 0.2083 0.1066 0.0423 0.1081 0.0080 9 Appendix Table 3 - Sensitivity table of hospital positive response rates (PRRs). Proportion of hospitals with a specified number of domains (rows) and overall PRR meeting or exceeding specified thresholds (columns). PRR threshold Number of ≥50% ≥75% ≥100% ≥1 98.1% 90.7% 88.3% ≥2 93.2% 83.3% 79.0% ≥3 88.9% 77.2% 64.2% ≥4 83.3% 66.0% 48.8% ≥5 75.3% 54.3% 35.8% ≥6 63.6% 40.7% 21.6% 7 39.5% 19.1% 6.8% Overall PRR 81.5% 55.6% 6.8% Domains 10 Appendix Table 4 - Sensitivity table of hospital positive response rates (PRRs) by hospital characteristics. Proportion of hospitals with an overall PRR meeting or exceeding specified thresholds (columns), stratified by hospital characteristics (rows). PRR threshold CHARACTERISTIC 50.0% 75.0% 100.0% Urban 87.3% 66.7% 7.9% Rural 77.8% 48.5% 6.1% Secondary or below 81.5% 55.6% 6.8% Tertiary 84.6% 64.6% 9.2% Eastern 87.5% 70.3% 7.8% Central 83.3% 50.0% 6.3% Western 72.0% 42.0% 6.0% Urban/rural Hospital Level Region 11 Appendix Table 5 - Variation in positive response rate (PRR) per question by participant type, organized by domain. PRR (abs) indicates absolute difference in PRR between principal investigator (PI) and study coordinator (SC). PI, SC, Total, Chi- Median Median Median PI Supportive learning environment SC PRR square PRR (abs) P-value* Range (IQR) (IQR) (IQR) PRR 1-7 6 (5,6) 6 (6,6) 6 (5,6) 88.82% 92.90% 4.08% 1.58 0.21 1-7 6 (5,6) 6 (5,6) 6 (5,6) 88.20% 91.61% 3.41% 1.56 0.21 1-7 6 (5,6) 6 (5,6) 6 (5,6) 85.09% 90.97% 5.87% 2.58 0.11 1-7 6 (5,6) 6 (5,6) 6 (5,6) 81.37% 82.58% 1.21% 0.08 0.78 In this workgroup, people value new D1 ideas. Differences in opinions are welcomed in D4 this workgroup. In this workgroup, people are open to D5 alternative ways of getting work done. People in this workgroup are eager to share information about what doesn’t D6 work as well as to share information about what does work. 12 If you make a mistake in this workgroup, it is often held against you. (Among clinicians taking care of patients with D10 1-5 2 (2,3) 2 (2,3) 2 (2,3) 63.35% 66.45% 3.10% 0.33 0.56 1-7 5 (5,6) 5 (5,6) 5 (5,6) 77.02% 76.77% 0.24% <0.01 0.96 D18 and discuss underlying assumptions that 1-7 5 (5,6) 6 (5,6) 5 (5,6) 85.71% 81.29% 4.42% 1.12 0.29 1-7 3 (2,5) 2 (2,4) 3 (2,5) 52.17% 61.29% 9.12% 2.67 0.10 1-7 2 (2,5) 2 (2,5) 2 (2,5) 61.49% 69.03% 7.54% 1.98 0.16 AMI, there is a tendency to blame individuals for errors in patient care). (negative) This workgroup engages in productive D17 conflict and debate during discussions. In this workgroup, we frequently identify might affect key decisions. Time for reflection There is simply no time for reflection in D21 this workgroup. (negative) In this workgroup, people are too busy to D22 invest time in improvement. (negative) 13 Leadership that reinforces learning My manager(s) establish(es) forums for and provide(s) time and resources for D23 1-7 5 (4,6) 5 (4,6) 5 (4,6) 65.22% 74.84% 9.62% 3.48 0.06 D24 provide(s) time and resources for reflecting 1-7 5 (4,6) 5 (4,6) 5 (4,6) 73.29% 70.32% 2.97% 0.34 0.56 1-7 6 (5,6) 6 (5,6) 6 (5,6) 79.50% 79.35% 0.15% <0.01 0.97 1-7 6 (5,6) 6 (5,6) 6 (5,6) 79.50% 82.58% 3.08% 0.49 0.49 1-7 5 (4,6) 5 (5,6) 5 (4,6) 68.32% 76.77% 8.45% 2.83 0.09 1-7 6 (5,6) 5 (5,6) 5 (5,6) 81.37% 83.23% 1.86% 0.19 0.67 identifying problems and organizational challenges. My manager(s) establish(es) forums for and and improving on past performance. D25 My manager(s) listen(s) attentively. My manager(s) invite(s) input from others D26 in discussions. Experimentation This workgroup experiments frequently D27 with new product/service offerings. This workgroup experiments frequently D28 with new ways of working. 14 This workgroup frequently employs pilot D29 projects or simulations when trying our 1-7 5 (3,5) 5 (3,5) 5 (3,5) 55.90% 57.42% 1.52% 0.07 0.79 D30 conducting and evaluating experiments or 1-7 5 (5,6) 5 (5,6) 5 (5,6) 77.02% 78.06% 1.05% 0.05 0.82 1-7 6 (5,6) 6 (5,6) 6 (5,6) 86.34% 85.16% 1.17% 0.09 0.77 1-7 6 (5,6) 6 (5,6) 6 (5,6) 80.75% 87.10% 6.35% 2.35 0.13 1-7 6 (5,6) 6 (5,6) 6 (5,6) 81.37% 83.87% 2.50% 0.35 0.56 new ideas. This workgroup has a formal process for new ideas. Training Experienced employees in this workgroup D31 receive training when new initiatives are launched. Experienced employees in this workgroup D32 receive training when shifting to a new position. Newly hired employees in this workgroup D33 receive adequate training. Knowledge acquisition 15 This workgroup has forums for meeting D35 with and learning from: Experts from 1-7 6 (5,6) 6 (5,6) 6 (5,6) 83.85% 85.16% 1.31% 0.10 0.75 D36 with and learning from: Experts from other 1-7 6 (5,6) 6 (5,6) 6 (5,6) 78.26% 80.65% 2.38% 0.28 0.60 1-7 5 (3,6) 5 (3,6) 5 (3,6) 53.42% 50.97% 2.45% 0.19 0.66 1-7 5 (5,6) 5 (5,6) 5 (5,6) 75.78% 76.77% 1.00% 0.04 0.83 1-7 6 (5,6) 6 (5,6) 6 (5,6) 80.12% 83.23% 3.10% 0.51 0.48 1-7 6 (5,6) 6 (5,6) 6 (5,6) 77.02% 82.58% 5.56% 1.51 0.22 outside the organization. This workgroup has forums for meeting departments/teams/divisions. This workgroup has forums for meeting D37 with and learning from: Customers/clients. This workgroup regularly conducts postD38 audits, after-action reviews, and debriefings. Performance monitoring This workgroup frequently compares its D7 performance to: Best-in-class organizations. D8 This workgroup frequently compares its 16 performance to: Other similar workgroups. This workgroup consistently collects D9 1-7 6 (6,6) 6 (6,7) information on technological trends. 17 6 (6,7) 95.65% 95.48% 0.17% 0.01 0.94 AMI, acute myocardial infarction 18 References 1. Singer SJ, Moore SC, Meterko M, Williams S. Development of a short-form Learning Organization Survey: the LOS-27. Med Care Res Rev. 2012;69:432-59. 2. Garvin DA, Edmondson AC, Gino F. Is yours a learning organization? Harvard Bus Rev. 2008;86:109-16, 34. 19
