CSA Innovations
advertisement
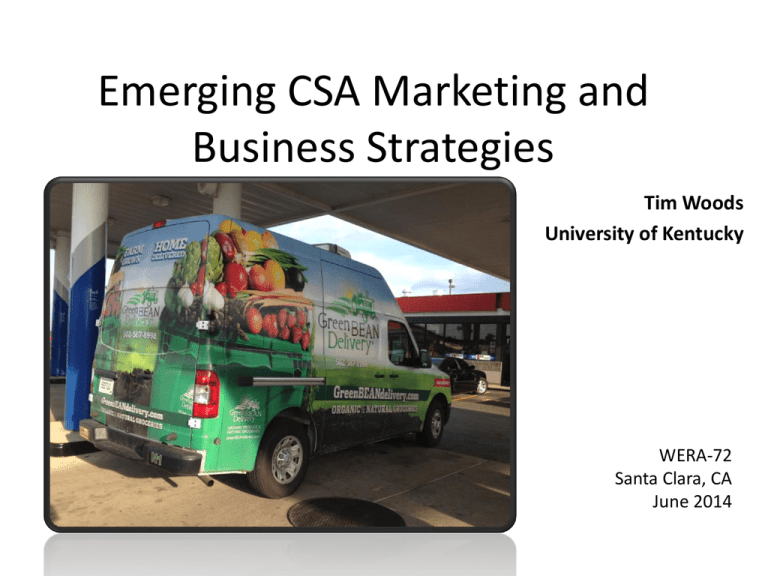
Emerging CSA Marketing and Business Strategies Tim Woods University of Kentucky WERA-72 Santa Clara, CA June 2014 USDA-AMS National CSA Emerging Business Strategies • Case-level observations • National survey of established CSAs Elmwood Stock Farm Central Kentucky • • • • • Evolution of traditional single farm CSA Complement to farm market and local branding Value added products – farm estate branding Sustainable food customer base Difficult to compete with local suppliers to restaurants and schools • Competition from local food aggregators also emerging – also from local university Elmwood Stock Farm Central Kentucky • Risks of shared CSA markets – – – – Shareholder relations Product quality Mission creep Farm branding limits • Demand for season extension – 18 to 22 weeks, fall shares – High tunnels, meats Farmer Dave’s/Many Hands Organic Farm • Partnering with urban community development agencies to reach lower income and inner-city shareholders – – – – – Harvard Medical School Boston Housing Authority Madison Park Development Corporation East Boston Neighborhood Health Center NOFA • Seafood CSA: Community Supported Fishery – extending the distribution model to a host of products Farmer Dave’s/Many Hands Organic Farm • • • • Shareholder recruitment SNAP and other subsidy facilitation Peer shareholder leadership Cooking classes, expanded community health programs • Food consumption behavioral studies • Shared missional fit with community food systems Elizabeth Gonzalez Suarez Trinity Property Management Connecting to Low Income Urban Shareholders $6-8 weekly subsidy per share through food income assistance programs Taking the CSA Beyond the Traditional Shareholder Base Ginger Turner CSA Manager for Farmer Daves (Dave Demaresq) Fair Prices for Farmers • Many Hands Organic Farm – Medium Vegetable Share: $16.25/week, $325/season • Farmer Dave – Fruit Share, $19.25/week, $250/season (13 weeks) – Small Vegetable: $21.50/week, $430/season – Regular Vegetable: $29.25/week, $585/season Source: Drew Love, Northeast Organic Farmers Assoc. CSA SNAPSHOT: PENNS CORNER FARM ALLIANCE (Pittsburgh, PA) Timeline: 1999 Formed marketing co-op to restaurants, $16,000 in sales 2003 Started CSA; 10 grower members 2007 Hires Neil Stauffer as GM 2008-11 +20% sales growth annually 2012 Add flower, winter CSA program; start processing tomatoes Four full-time staff Acquired 3800 sq. ft. Pittsburgh warehouse, office, cooler space Size: traditional cooperative of 36 farms, including a 12-farm Amish/Mennonite cooperative (Clarion River Organics) CSA Members: ~700 2012: 509 spring shares, 630 harvest shares, 237 biweekly winter shares; 15 flower shares; ~30 egg shares Other Outlets: Direct-to-restaurant, online ordering “Farm Stand” Sales: $1.4 million in 2012; about 20% annual sales growth 2008-11 Future Plans: Continuing CSA; expand Farm Stand online ordering; dabbling in providing locally sourced foods to universities, private schools; developing Gift Basket line; encouraging high-end cheesemaking in the region. Downtown warehouse location • Rapid expansion of ecommerce • Small Farm Central • CSA, farm stand, restaurant/wholesale FairShare Madison, Wisconsin • Association of organic CSAs • Health Insurance Rebate program – Physician’s Plus • Cookbook sales funding substantial cooperative programming • Coalition support from Extension, medical community, strong local foods culture • Coalition able to provide – specialized CSA training for members – Shareholder recruitment – Community and fundraising benefits FairShare Health Rebate Program Growth 2005 2006 2007 2008 2009 2010 2011 2012 Estimated total rebates issued 96 972 1282 3550 6100 6800 7300 7200 Approximate # of shares available via FS farms 2000 2800 3500 4500 6950 8650 8733 9700 Denver Area CSAs • CSA community post-Grant Farms (failed 10,000 share CSA) • Urban CSAs – links with Denver Housing Authority • CSA as a connection to city planning • Strong local foods and sustainable ag community in region Granata Farms CSA and Urban Farmers Collective Downtown Denver, CO Star Acre Farms Contrast Multi-Farm CSAs • Fair Shares CCSA (Combined Community Supported Agriculture) – St. Louis-based 450 share multi-farm CSA network – Around 40 farms, meat, produce, coffee, bread, pasta, cheese – Private venture • Grasshoppers Kentucky-based food hub/CSA/specialty foods distributor – – – – 40-50 KY and IN farms Wide diversity of fresh and processed products CSA a shrinking share of the business Significant public investment from state Strategic reach CSA Shareholders Grocer Specialty wholesaler Peapod Value Proposition Periphery More price sensitive Mid-Level Food hubs Local food aggregators Multi-farm CSAs Core Traditional single farm CSA Less price sensitive Seasons CSA in Operation and Size pct 30 26.7 2014 25 144.6 20 15 10 13 6.5 7 5 12 2013 13 8 6.5 127.4 5.2 3 2012 120.1 1 2 3 4 5 6 7 8 9 10+ 0 0 50 100 150 Average shares N=424 200 CSA Production Orientation Production Methods Percent My CSA is certified organic 25.8 I produce according to organic standards, but I’m not certified 59.8 I incorporate some organic along with conventional methods 12.9 I use primarily conventional growing techniques 1.5 N=458 Ranking emerging competition relating to your CSA farm markets new CSAs entering the market Established CSAs expanding natural food stores traditional grocers offering local food other home food delivery services high end grocers restaurants offering local food 0 Forced rating highest to lowest 1 2 3 4 5 6 7 8 CSA location distribution Location N Percent Near (within 50 miles) a large city (over 1 million) 105 24.4 Near (within 50 miles) a small city (250,000-1 million) 142 33.0 Small town 114 26.5 Countryside 69 16 How would you rate the demand for local food in your market area? Change Percent No good basis for knowing 1.6 Declining significantly 1.0 Declining somewhat 2.6 Staying about the same 10.9 Increasing somewhat 59.3 Increasing significantly 24.7 How would you rate the demand for local food in your market area? percent Change Rural Urban No good basis for knowing 1.1 2.0 Declining significantly 0.0 1.6 Declining somewhat 3.8 1.6 Staying about the same 14.8 8.1 Increasing somewhat 57.9 60.3 Increasing significantly 22.4 26.3 CSA shareholder recruitment for this year (2014) compared to previous few years has been…. Change Percent Much less difficult 10.6 Somewhat less difficult 15.7 About the same 45.5 Somewhat more difficult 19.7 Much more difficult 5.3 Doesn’t apply 3.2 Farm Sales from CSAs Share of your total farm sales comes from your CSA Location Mean SD Min Max Obs. Near large city 55.00% 32% 0 100% 105 Near small city 56.00% 31% 0 100% 142 Small town 53.00% 29% 0 100% 114 Countryside 45.00% 28% 0 100% 69 Average 52.25% 30% 0 100% 107.5 Consider the following potential changes to your CSA production since it began - please indicate where it may apply Business function Does not apply Decreased a lot Decreased some About the same Increased some Increased a lot Scale and variety of products offered 1.4 1.7 4.8 20.7 43.3 28.1 Processed products offered 51.2 0.5 1.9 18.0 22.3 6.1 Season extension technologies 14.5 0.5 0.7 21.8 40.1 22.3 Product sourcing from other producers 50.6 2.2 2.2 16.8 21.9 6.3 On-farm shareholder activities 32.8 2.0 6.8 31.4 22.1 4.9 Share packing on the farm 38.7 3.2 2.0 39.5 10.1 6.6 What we are learning • CSA agency and community partnerships that bridge entry barriers – helping with logistics, education, retention. • Scale economies still important in distribution and promotion. Tension between “authentic” farmer and community relationship objectives and subscription delivery model (Peapod and others)/ other scale efforts What we are learning • E-commerce a core part of CSA business with growing applications for management • Rapid expansion in new products marketed through the CSA model • Proximity to urban markets impacts market opportunity and distance may make cooperation more compelling.

