Chapter 6: Water and Seawater
advertisement

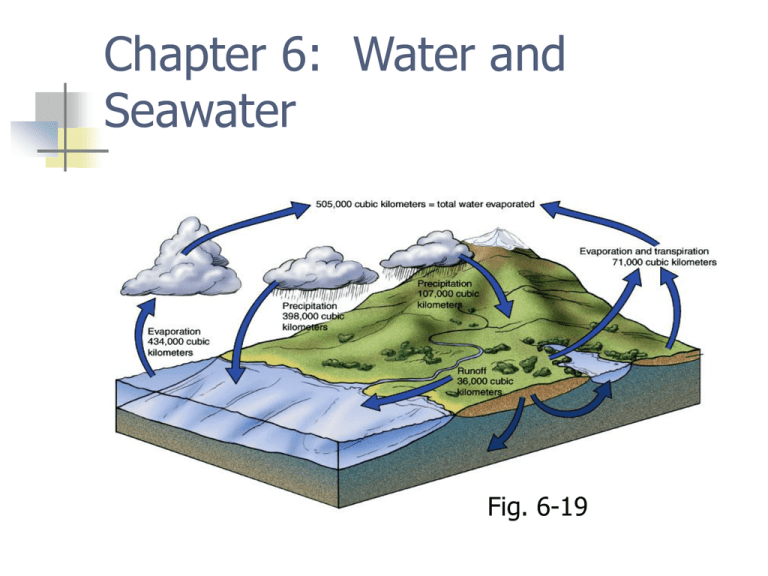
Chapter 6: Water and Seawater Fig. 6-19 Atomic structure Nucleus Protons and neutrons Electrons Ions are charged atoms Water molecule H2O Two hydrogen, one oxygen Bonded by sharing electrons Bend in geometry creates polarity Dipolar molecule Dipolar molecule Weak negative charge at O end Weak positive charge at H end Hydrogen bonds Weak bonds between water molecules and ions Explains unusual properties of water Fig. 6-3 Two unusual properties High surface tension Hydrogen bonding creates “skin” Important for living organisms Capillarity Universal solvent Electrostatic bond between dipolar water and ions Ocean is salty Fig. 6.4 Fig. 6-5b Thermal properties of water Solid, liquid, gas on Earth’s surface Water has high freezing point Water has high boiling point Water has high heat capacity Water has high latent heats Fig. 6-7 Heat capacity Heat absorbed or released with changes in state Latent heats of Melting; freezing Vaporization, evaporation Condensation Global thermostatic effects Moderate global temperature Evaporation removes heat from oceans Condensation adds heat to atmosphere Heat re-distributed globally Differences in day and night temperatures Water density Maximum density at 4oC Ice less dense than liquid water Atomic structure of ice Ice floats Increased salinity decreases temperature of maximum density Fig. 6-10 Fig. 6-8 Seawater Salinity=total amount of solid material dissolved in water (g/1000g) Typical salinity is 35 o/oo or ppt Brackish (hyposaline) < 33 ppt Hypersaline > 38 ppt Measuring salinity Evaporation Chemical analysis Principle of Constant Proportions Chlorinity Electrical conductivity (salinometer) Dissolved substances Added to oceans River input (primarily) Circulation through mid-ocean ridges Removed from oceans Salt spray Recycling through mid-ocean ridges Biogenic sediments (hard parts and fecal pellets) Evaporites Residence time Average length of time a substance remains dissolved in seawater Long residence time = unreactive Short residence time = reactive Higher concentration in seawater Smaller concentration in seawater Steady state Ocean salinity nearly constant through time Dissolved gases Solubility depends on temperature, pressure, and ability of gas to escape Gases diffuse from atmosphere to ocean Wave agitation increases amount of gas Cooler seawater holds more gas Deeper seawater holds more gas Conservative vs. nonconservative constituents Conservative constituents change slowly through time Major ions in seawater Nonconservative constituents change quickly due to biological and chemical processes Gases in seawater Oxygen and carbon dioxide in seawater Nonconservative O2 high in surface ocean due to photosynthesis O2 low below photic zone because of decomposition O2 high in deep ocean because source is polar (very cold) ocean CO2 low in surface ocean due to photosynthesis CO2 higher below photic zone because of decomposition Deeper seawater high CO2 due to source region and decomposition Acidity and alkalinity Acid releases H+ when dissolved in water Alkaline (or base) releases OHpH scale measures acidity/alkalinity Low pH value, acid High pH value, alkaline (basic) pH 7 = neutral Carbonate buffering Keeps ocean pH about same (8.1) pH too high, carbonic acid releases H+ pH too low, bicarbonate combines with H+ Precipitation/dissolution of calcium carbonate CaCO3 buffers ocean pH Oceans can absorb CO2 from atmosphere without much change in pH Fig. 6-17 How salinity changes Salinity changes by adding or removing water Salinity decreases by Precipitation (rain/snow) River runoff Melting snow Salinity increases by Evaporation Formation of sea ice Hydrologic cycle describes recycling of water Fig. 6-19 Hydrologic cycle Horizontal variations of salinity Polar regions: salinity is lower, lots of rain/snow and runoff Mid-latitudes: salinity is high, high rate of evaporation Equator: salinity is lower, lots of rain Thus, salinity at surface varies primarily with latitude Fig. 6-20 Vertical variations of salinity Surface ocean salinity is variable Deeper ocean salinity is nearly the same (polar source regions for deeper ocean water) Halocline, rapid change of salinity with depth Density of seawater 1.022 to 1.030 g/cm3 Ocean layered according to density Density of seawater controlled by temperature, salinity, and pressure Most important influence is temperature Density increases with decreasing temperature Salinity greatest influence on density in polar oceans Pycnocline, rapid change of density with depth Thermocline, rapid change of temperature with depth Polar ocean is isothermal Layers of ocean Mixed surface layer Pycnocline Deep ocean End of Chapter 6: Water and Seawater


