A South Asian Private Sector Perspective to Emerging Employment
A South Asian Private Sector Perspective to Emerging Employment Prospects
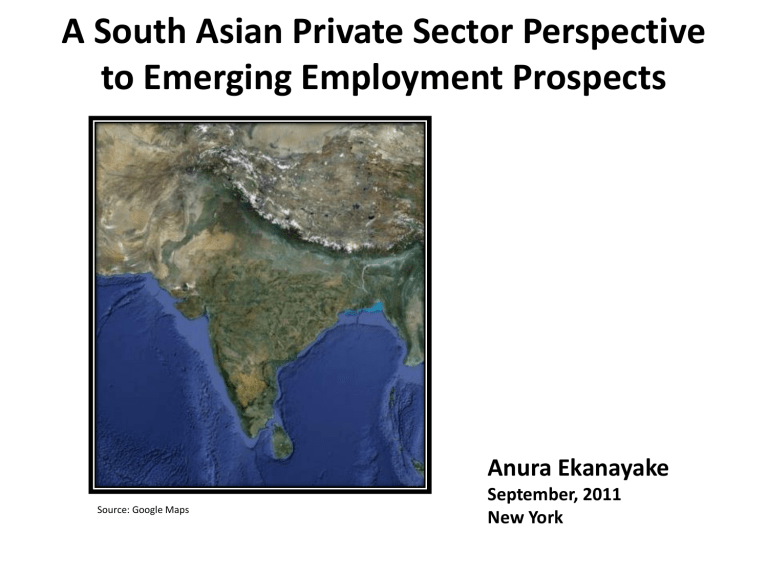
Source: Google Maps
Anura Ekanayake
September, 2011
New York
Abstract
Emerging employment prospects in South Asia are discussed based on some mega global trends and selected key developments of significance to business in the region. While available secondary data and relevant research are utilized for specific elements in the discussion, the synthesis of these in a holistic picture, admittedly is of a “crystal ball gazing” nature. The justification for this approach being that private sector decisions are often made in this manner.
• South Asia in Brief
Contents
• South Asian private Sector
• How Business People Respond to Markets
• Some Mega Trends Relevant to South Asia
• Key developments in South Asia
• Constraints
• Adjustment Costs in Transition
• Business Prospects
• Employment Out Comes
• Policy Implications
South Asia in Brief
• South Asia – Afghanistan, Bangladesh, Bhutan, India, Maldives, Nepal, Pakistan and Sri Lanka
• Geography – elevation ranges from Maldives entirely at sea level to the Himalayas in Nepal, with climate varying from tropical in the south to temperate in the north, with tropical rainforests to hot and cold desserts.
• Demography – accounts for almost one quarter of world population with India accounting for
1.2 billion people, a young and growing labour force, and low but rapidly improving education.
• Economy – Accounts for half of the worlds poor with per capita GDP ranging from US$ 6900 in Maldives to US$ 900 in Afghanistan (in PPP 2010). Agriculture in the economy ranges from
32% of GDP and 79% of employment in Afghanistan to 5.6% and 11% respectively in the
Maldives.
• HDI – overall index ranking ranges from 91 in Sri Lanka to 155 in Afghanistan.
• Ease of Doing Business ranking ranges from 83 for Pakistan and 167 for Afghanistan.
• Global Competitiveness Index ranking ranges from 52 in Sri Lanka to 125 in Nepal.
• Interestingly when the two economies with less than a million people are left out the country with the highest per capita GDP, Sri Lanka, has the highest HDI, the highest GCI and the second highest DBI ranking.
• Conversely Afghanistan has the lowest per capita GDP, lowest HDI and the lowest DBI ranking.
Table 1
Some Key Data on South Asian Economies
Population GDP / Cap
Country (ml in 2010) (PPP 2010) Index
HDI 2010 1/
Rank
Global Comp.ness 2/ Doing Business 3/
Index Rank Rank
Afganistan
Bangladesh
29.8
900
158.5
1700
Bhutan
India
0.7
5500
1189.0
3500
Maldives
Nepal
Pakistan
0.4
29.3
6900
1200
187.3
2500
Sri Lanka 21.2
5000
World 6928 11000
Notes:
1/ Out of 169 countries
2/ 2011/12, out of 142 countries
3/ Ease of Doing Business 2011 out of 183 countries
0.349
0.469
0.519
0.602
0.428
0.490
0.658
155
129
119
107
138
125
91
3.73
4.30
3.47
3.58
4.33
108
56
125
118
52
167
107
142
134
116
83
102
South Asian Private Sector
• Non homogeneous,
• Global MNCs operating in South Asia
• A few local MNCs with global operations
• Some large local conglomerates
• A larger percentage of Medium sized businesses
• Predominance of small and micro enterprises, accounting for 60% of employment and 40% exports.
• Very different in the way they behave
How business people respond to markets
• Multinationals and large conglomerates have the resources and the capacity to be proactive. Most have corporate strategy units to monitor global developments and strategize. They may carry out scenario planning, SWOT analysis and ‘Blue Ocean’ strategizing.
• Others respond to market signals and are reactive to varying degrees
• Large businesses react to global and national market signals
• Medium and Small businesses react to local market signals
• Micro enterprises react to neighbourhood market signals
• There are firm specific differences, but the above is the general pattern.
• Business people look for business opportunities, job creation is an outcome and not a business objective / goal.
• Essentially what is presented is an optimistic overall view characteristic of private enterprise and not a “dismal” one.
Some Mega Trends relevant to South
Asia
• Trends which ‘we have to come to terms with’!
• Global slow down in the medium term
• High growth in Asia and growing intra Asian trade (
42% to
47% of the large economies as per ADB 2011
)
• The shifting centre of gravity towards Asia, with ‘rebalancing’.
• Limited natural resource availability, climate change may have drastic impacts ( consumption of natural resources / capita / day in North America was 88 Kgs. compared to 14 Kgs. In Asia
)
• Rapid urbanization
• Technological change elsewhere and their speedy adoption / adaptation in South Asia ( example of ICT
)
Global GDP Growth
Figure 1
Source: WEO June 2011, IMF
Trade Volumes
Advanced
Economies
Emerging/
Developing
Economies
2010
Import Export Import Export
-12.2
-12.4
5.8
International Monetary Fund, World Economic Outlook, June ,2011
Table 2
Key Developments in South Asia
• Growing middle class in India, 50 ml in 2007 to 267 ml by
2016 and 523 ml in 2025 (
NCAER 2011, MGI 2007
); accelerating consumption.
• Growing labour force and the demographic dividend
• Rapid rise in educational attainments
• Capability to rapidly adopt / adapt new technology
• Culture of ‘hard work’.
• Low per capita use of resources
• High propensity to save
• Extended family and low pressure on public support
• Potential role of India similar to that of China in East and
South East Asia
Projected Demand for Consumer Durables in India
Table 3
Source: NCEAR 2005
Source: The Economist 21 st July 2011
Figure 2
Constraints
• Barriers to trade ( trade facilitation reforms can increase intra regional trade by 75% and inter regional trade by 22% according to Herzal and Mizra 2009)
• Low ‘ease of doing business’ and all related constraints
• Mistrust among nations
• War for talent – attraction, motivation and retention
( widespread shortage of skilled labour in South Asia, across the board labour shortage in Sri Lanka
)
• Gap in skills and aspirations – nearly 10% of youth (age 15 – 24 yrs) unemployed. 20% in Sri Lanka
• Gender gap – (
In Sri Lanka for every one female of 15 yrs and above in the labour force two are out side the labour force)
• Poor access to capital for micro and small businesses
• Poor infrastructure
World Ranking in
Ease of Doing Business (2010)
Table 4
Bangladesh
Siri Lanka
Pakistan
Malasya
Thailand
Philippines
Vietnam
Taiwan
Mongolia
Nepal
107
102
83
21
19
148
87
33
73
116
Ease of
Doing
Busines s
Starting a
Business
79
Dealing with
Construc tion
Permits
116
34
85
113
95
156
169
98
108
12
156
100
24
85
96
62
95
104
130
Registeri ng
Property
172
155
126
60
19
102
43
32
27
25
Getting
Credit
Protectin g
Investor s
72
72
65
10
72
128
15
72
72
89
20
54
28
40
12
132
173
74
28
74
Paying
Taxes
93
166
145
32
91
124
124
87
66
123
Trading
Across
Borders
Enforcing
Contracts
Closing a
Business
112
72
81
37
12
61
63
17
158
164
179
137
155
59
25
118
31
90
35
123
101
43
67
55
46
153
124
10
119
107
Intra-regional Trade as a Share of GDP, 2008
60%
50% 48,1%
40%
30%
31,4%
20%
13,0%
10%
9,0%
7,2%
5,5%
0%
Europe & Central
Asia
East Asia &
Pacific
Sub-Saharan
Africa
Latin America &
Caribbean
Middle East &
North Africa
Source: World Development Indicators Database
South Asia
Figure 3
Export Destinations of SAARC Countries 2009
Country Exports to
EU
2009 (%)
Exports to
US
2009 (%)
Other
Bangladesh
Sri Lanka
Pakistan
India
Maldives
Nepal
Bhutan
Source: WTO
51.2
36.9
24.6
20.5
31
11.1
-----
25.7
23.1
18.3
10.8
-----
7.1
-----
23.1
40
57.1
68.7
49 (Thailand)
63.5 (India)
93.5 (India)
Table 5
A Brief Comparison of SAARC with EU and ASEAN
SAARC
ASEAN
EU
Membership
Original Current
Trade Liberalization
Significant Dates Intra regional trade - 2005
7 4-5%
5
6
8 SAPTA – 1993
SAFTA – 2005
10 AFTA – 1992
27 EU single market launched in 1992
25%
66.60%
Table 6
Adjustment costs in transition
•
Transition from inter regional to intra – regional trade, investment and business
•
Transition from commodities to value added
•
Serving the new middle class and urban middle and working class communities
•
Costs of information, business contacts, capital, technology and skills
•
Not a case of instant switching from one to another
Business Prospects
• Catering to the needs of the growing regional Middle Class
• Catering to the needs of regional urbanization including infrastructure
• Building regionally integrated supply chains
• Exporting to new Asian markets
• Competing better in the old ‘mature’ markets
• Developing niches ‘sending coal to new castle’
• Adapting /adopting technology fast at lower costs to those of the pioneers
• Leapfrog, synergize and create fusion
• Specifically for Sri Lanka plugging into the Indian growth generator appears to be the best prospect in the light of the global slowing down and ‘re-balancing’.
Example 1
Example 2
Example 3
Example 4
Employment Out-Come
• Futile to attempt listing specific industries or even sectors given the complexity of the environment and the ingenuity of the private sector – how can policy makers second guess enterprise?
• FMCG and CDs, construction, transportation, leisure, services are obvious.
• Even with growing middle class and urbanization, the consumption patterns will not exactly replicate those of the West, but the sheer number of middle class people will boost the demand.
• Low resource intensive, highly ICT leveraged, knowledge intensive and relatively labour intensive businesses.
• Continuing high share of micro enterprises leveraged by ICT and low costs and linking with local value chains.
• Will depend on PPP in skill development and private initiatives in attracting, motivating and retaining employees.
Policy Implications
• Greater regional economic integration
• Trade liberalization instead of industrial policy
• Reduced tariff and non tariff behind the border barriers to trade
• Continuing and even increased investment in education, health and physical infrastructure
• Greater private sector participation in education
• Vocational training and seed capital for youth
• Attract more females to the labour force
• Allowing private enterprise to decide ‘what’ to do
‘when’, ‘where’ and ‘how’.
