Advisory Committee on Enrollment: Minutes – Tuesday, 6 October
advertisement
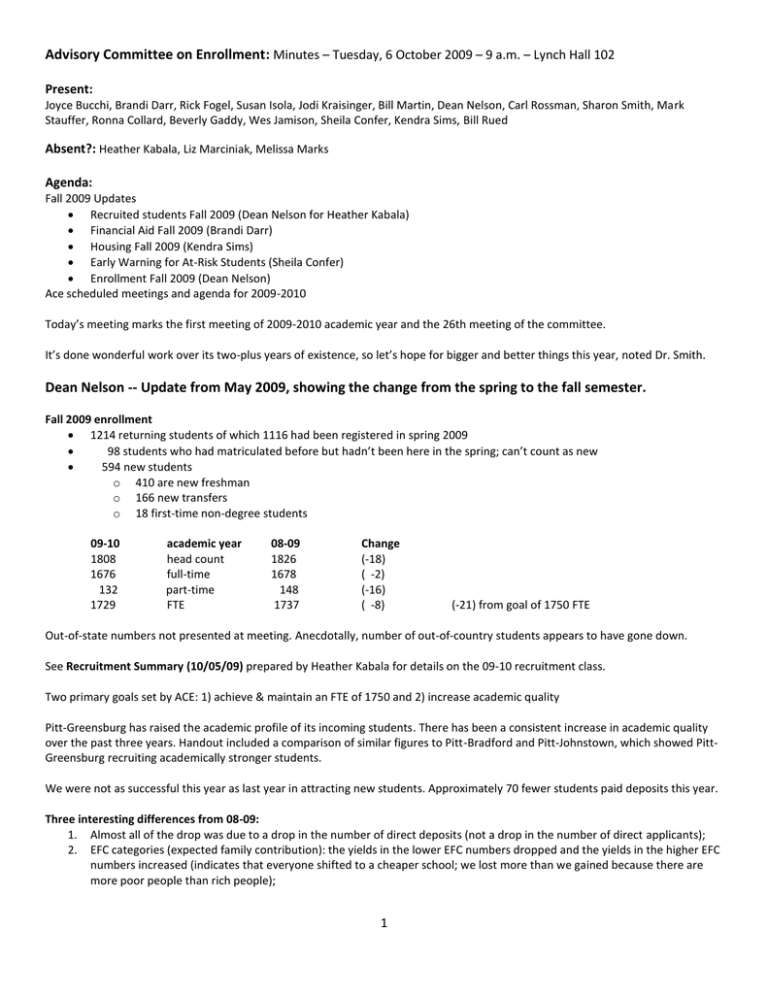
Advisory Committee on Enrollment: Minutes – Tuesday, 6 October 2009 – 9 a.m. – Lynch Hall 102 Present: Joyce Bucchi, Brandi Darr, Rick Fogel, Susan Isola, Jodi Kraisinger, Bill Martin, Dean Nelson, Carl Rossman, Sharon Smith, Mark Stauffer, Ronna Collard, Beverly Gaddy, Wes Jamison, Sheila Confer, Kendra Sims, Bill Rued Absent?: Heather Kabala, Liz Marciniak, Melissa Marks Agenda: Fall 2009 Updates Recruited students Fall 2009 (Dean Nelson for Heather Kabala) Financial Aid Fall 2009 (Brandi Darr) Housing Fall 2009 (Kendra Sims) Early Warning for At-Risk Students (Sheila Confer) Enrollment Fall 2009 (Dean Nelson) Ace scheduled meetings and agenda for 2009-2010 Today’s meeting marks the first meeting of 2009-2010 academic year and the 26th meeting of the committee. It’s done wonderful work over its two-plus years of existence, so let’s hope for bigger and better things this year, noted Dr. Smith. Dean Nelson -- Update from May 2009, showing the change from the spring to the fall semester. Fall 2009 enrollment 1214 returning students of which 1116 had been registered in spring 2009 98 students who had matriculated before but hadn’t been here in the spring; can’t count as new 594 new students o 410 are new freshman o 166 new transfers o 18 first-time non-degree students 09-10 1808 1676 132 1729 academic year head count full-time part-time FTE 08-09 1826 1678 148 1737 Change (-18) ( -2) (-16) ( -8) (-21) from goal of 1750 FTE Out-of-state numbers not presented at meeting. Anecdotally, number of out-of-country students appears to have gone down. See Recruitment Summary (10/05/09) prepared by Heather Kabala for details on the 09-10 recruitment class. Two primary goals set by ACE: 1) achieve & maintain an FTE of 1750 and 2) increase academic quality Pitt-Greensburg has raised the academic profile of its incoming students. There has been a consistent increase in academic quality over the past three years. Handout included a comparison of similar figures to Pitt-Bradford and Pitt-Johnstown, which showed PittGreensburg recruiting academically stronger students. We were not as successful this year as last year in attracting new students. Approximately 70 fewer students paid deposits this year. Three interesting differences from 08-09: 1. Almost all of the drop was due to a drop in the number of direct deposits (not a drop in the number of direct applicants); 2. EFC categories (expected family contribution): the yields in the lower EFC numbers dropped and the yields in the higher EFC numbers increased (indicates that everyone shifted to a cheaper school; we lost more than we gained because there are more poor people than rich people); 1 3. Almost all the students who didn’t come were females (64 fewer females and six fewer males); most were direct. We couldn’t easily identify why this happened. a. Look at sex distribution of option students b. More women may have been part of the lower EFC categories SVC class looks almost identical to last year’s class, but they had to pay four percent more for it. They reduced their tuition discount by four percent to get the class, which was about an extra $400,000. First year retention on-campus: Freshmen retained last year at 70.1 percent. Observation: our retention efforts to date haven’t made a change. This is the first year for some of our retention efforts. The rising quality should push retention up. Compared to other institutions: Slippery Rock University has an average SAT of 1030 and their first-year retention is in the high 70s. Because our students have the option of going downtown, our in-system retention may be higher (management, engineering students can go downtown). Education program will help us to compensate for those we lose to Pitt Oakland. Brandi Darr – Financial Aid Report See Financial Aid 2009-2010 vs Financial Aid 2008-2009 handout for details First round of freshman letters went out one week earlier than last year, so the packaging could begin sooner and sent out 49 more than last year. May 1 is cutoff date for freshman. We have current freshmen who are doing financial aid right now. We did a better job of getting letters to freshmen and doing it sooner. We are still bound by when Oakland starts. o o o o o o o Bad economy = higher Pell Grant numbers PHEAA Grant = allocations still not set because PA state budget isn’t approved; adjustments will be made in the spring Alternative loans are down 132 students/$1 million = combination of harder to get a loan this year and students aren’t over- borrowing to cover living expenses SEOG & Perkins = students must meet requirements to receive money ACG1 (academic competiveness grant) = PELL-eligible students who took a rigorous high school program ACG2 (academic competiveness grant) = student must have maintained a 3.0 GPA as a freshman SMART = PELL-eligible students in math, science, engineering who maintain a 3.0 GPA in 3rd & 4th years Financial Aid Changes: o ACG & SMART will be eliminated in 2010-2011, because they weren’t as effective as thought. o FASTA – if you file your income tax before the FASTA deadline, applicant can go straight to IRS to provide information. FASTA deadline is March 1, so many students might not have filed taxes this early. As long as they’ve filed a 1040, it is accessible. o Direct lending is expected to change. Banks will be eliminated from the student loan package. All loans will go through the Dept. of Education. Legislation has passed the House, now in the Senate. This is a major change that would require new forms and new promissory notes. It would go into effect July 1. It would affect every student in the country who is seeking a student loan. Savings to the program are supposed to be put into the Pell Grant Program. o Alternative loans are non-federal student loans; an educational loan that is not a Title-IV program loan; Financial Aid office will certify those loans. o REQUEST to see -02 scholarship money also reported during Financial Aid section. Institutional Scholarship criteria will change: in the past based only on SAT scores; this year we’re using SAT scores to determine eligibility, then determine size of award based on high school GPA and class rank percentile. Those criteria are most closely linked to success once they are in college. The hope is to attract students who will be more successful. 2 Kendra Sims – Housing Report Housing is down, which was expected because of the economy. Housing or living on campus is seen as a luxury when you’re trying to figure out how to pay for school. As of September 9, 2009: 09-10 294 returning students in housing 315 new & transfer students 609 active housing applications 114 cancellations 08-09 338 365 703 87 Change (-44) (-50) (-94) 27 Loss rate during the first semester: lose approximately 30 to 40 students. Expect to be below budget in the spring unless we see a significant increase in the number of students who want to come back and want to be on campus. It is typical to get 10-15 students back in the spring. We’ll lose students to graduation and study abroad. We will be down in the fall unless a larger number of freshmen choose to live on campus. We’ll lose a large chunk of upper class students to transfers and those who think they are too adult to live on campus. Capacity: about 720, using lounges, etc.; 675 without lounges (includes doubling and tripling) Budget: 575 on campus. Staff is looking at increasing retention of students living on campus. One idea they are looking at is allow the $150 housing deposit to rollover from year-to-year. Might be difficult to do because it is credited back to the student in the spring. Students look at this option as a way to maintain where they live and get preference for where they live. Transfer students tend to want to have a private/single room, which can’t be guaranteed. Suggestion to create a transfer floor, which would allow students with a similar experience to be living together. A departmental goal is to develop a new residential community, so this might be a viable suggestion. Sheila Confer – MAP-Works Report MAP-Works is an attempt to identify at-risk students as early as possible. Students take a survey and answer various questions, including” are you planning to return here next semester.” Fourteen students have said they won’t be back next semester. We lost one already within hours of having contacted the academic advisor. People who are working with the students can be intentional and accurate when reaching out to these students. * See MAP-Works Progress – ACE Committee Report 10/05/09 (handout) for details. o o 410 FR and 3 upperclassmen took the survey (incentives provided, required as FR seminar) 298 students have responded (72.68 percent response); expects to have an 80 percent response rate when survey closes. o o 80 identified as at-risk 58 have been contacted in some way (FR seminar instructor, peer leader, advisor, financial aid, coach, resident life staff, commuter mentor, etc.) 22 have not been contacted at this time o Information input into the program prior to students taking the survey: SAT scores, high school information, number of credits. Some responses are open, most are based on a seven-point scale. First survey contains 184 questions. A check-up survey of 25 questions will be emailed next, which will help to determine if interventions were successful. Mid-term grades will also be uploaded into the system. Final grades and enrollment for spring term will also be uploaded. Another feature is interactive videos that show students how their responses/habits will impact their academic goals. For example, how someone’s study habits will affect their goal of earning a certain grade-point average. 3 Dean Nelson – Wrap-up MAP-Works saves the answers and uses built-In mathematical models based on behaviors of past students. General model being used now because we don’t have any data in there. As our data grows, the models will be tailored to fit our students and allow us to better predict outcomes. Meeting Schedule -- First & third Tuesday of the month: October 6; October 20; November 3; November 17; December 1; December 15. Third-year focus: Developing a strategic enrollment plan (see Dean’s outline in Power Point slides). Mission, Values, Vision for the college; enrollment goals using historic data and projections; map out the conditions; external conditions (competitors, market, etc.); add in the recruitment initiatives and retention initiatives. Meeting ended with a discussion of how to move forward as a new mission statement remains in development. Homework: check out www.SRU.edu/Pages/9312.ASP for an example of Slippery Rock University’s Strategic Enrollment Plan. 4

