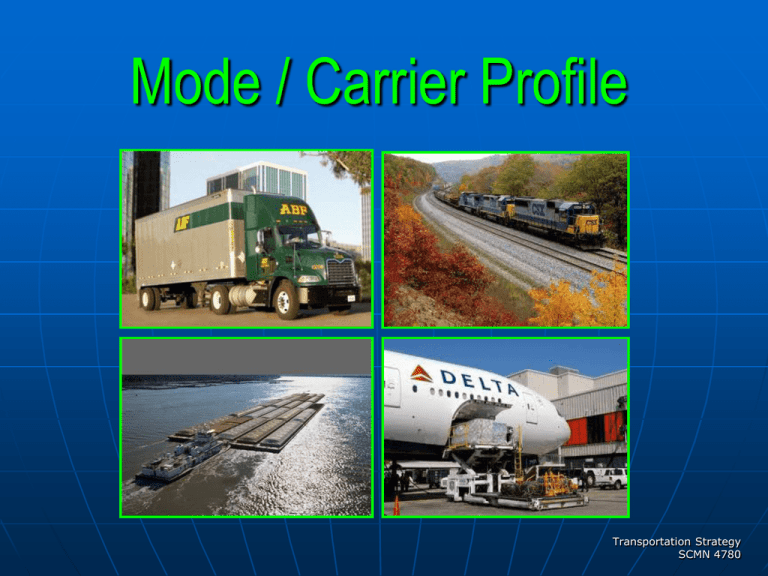
Mode Profile
advertisement

Mode / Carrier Profile Transportation Strategy SCMN 4780 Shipper’s Transportation Network Inbound Transportation SUPPLIER Outbound Transportation PRODUCER (Shipper) CUSTOMER Reverse Logistics Modal Carrier Profile 2 Transportation Strategy SCMN 4780 2010 Products Shipped ($B) Machinery 578 573 Electronics 1,759 Motorized Vehicles 689 Mixed Freight 692 Pharmaceuticals 1,430 696 880 1,267 1,061 Textiles / Leather Manufactured Products Gasoline Plastics / Rubber Raw Materials Modal Carrier Profile 3 Transportation Strategy SCMN 4780 Transportation Mode Management Establish Freight Control Points Identify Performance Variables Select Best Transport Mode Select Carrier Negotiate Rates & Service Levels Evaluate Carrier Performance Modal Carrier Profile 4 Transportation Strategy SCMN 4780 US Transportation – Recent History Total Logistics Cost* as % of US GDP * Logistics Cost is cost of moving, storing and managing goods Modal Carrier Profile 5 A major factor in the decline of total logistics cost has been reduced transportation costs. Transportation costs are lower because: • Deregulation & subsequent restructuring of the freight transportation industry in the 1980s which triggered strong competition and lower shipping prices; • Public investment in the US Interstate highway system in the 1980s and early 1990s reduced travel time and improved trip reliability for motor carriers; and • Adoption of new technologies such as intermodal freight containers, e-Business, RFID tags, and satellite communications significantly improved the productivity and reliability of freight operations. Transportation Strategy SCMN 4780 US Domestic Modal Statistics 2010 US Shipments * Truck (TONS) ($B) 12,490 68% 10,515 65% 1,776 10% 427 3% 860 5% 343 2% 12 0% 999 6% Intermodal 1,380 8% 2,739 17% Pipeline 1,494 8% 719 4% 302 2% 323 2% Rail Water Air Other Total 18,313 16,065 * Source: US Department of Transportation Modal Carrier Analysis 6 Transportation Strategy SCMN 4780 Current Logistics Cost Situation In a survey commissioned by the Council of Supply Chain Management, logistics costs rose to 8.3% of US GDP in 2010 vs. 7.7% in 2009. • Cost of US business logistics jumped to $1.2 Trillion in 2010 (up $114 B) • Inventory carrying costs increased 10.3% last year due to higher costs of taxes, obsolescence, depreciation and insurance. • Transportation costs were up 10.3% from the 2009 levels with trucking lagging behind the performance of other transportation modes. With bleak prospects regarding the economy, transportation managers will continue to see freight costs increase and will have to answer to management as to why. What can shippers do to minimize the impact of freight cost increases? 1. 2. 3. 4. 5. 6. Modal Carrier Profile Understand what you are paying for, not just base rates but fuel surcharges and all accessorial fees Consolidate shipments when possible including consolidating small parcel shipments into LTL quantities and LTL quantities into truckloads Do not use expedited services unless they are absolutely required. Continually benchmark the competition’s rates and charges Understand your carriers’ costs; what if anything can you do to reduce their costs so they can pass those savings back to you Perform a comprehensive audit of your entire transportation spend using an outside audit firm 7 Transportation Strategy SCMN 4780 US Domestic Modal Statistics 2010 US Shipments - Tons Truck Modal Carrier Profile Rail Water Air Intermodal 8 Pipeline Other Transportation Strategy SCMN 4780 US Domestic Modal Statistics 2010 US Shipments - Value ($B) Truck Modal Carrier Profile Rail Water Air Intermodal 9 Pipeline Other Transportation Strategy SCMN 4780 Unites States Highway System Modal Carrier Profile 10 Transportation Strategy SCMN 4780 Highway System Congestion Federal legislation to improve the US highway system discussion Modal Carrier Profile 11 Transportation Strategy SCMN 4780 CSA 2010 – Legislation Description Compliance, Safety, Accountability is a Federal Motor Carrier Safety Administration initiative to improve large truck and bus safety through reducing crashes, injuries, and fatalities that are related to commercial motor vehicles. CSA 2010 introduces a new enforcement and compliance model that allows FMCSA and its State Partners to contact a larger number of carriers earlier in order to address safety problems before crashes occur. Rolled out in December 2010, the program establishes a new nationwide system for making the roads safer for motor carriers and the public alike! CSA Operational Model – implement a Safety Measurement System SMS) that … • quantifies the on-road safety performance of carriers and drivers to identify candidates for interventions • determines the specific safety problems the a carrier or driver exhibits • monitors whether safety problems are improving or worsening SMS uses a motor carrier’s data from roadside inspections, including all safety-based violations, State-reported crashes, and the Federal motor carrier census to quantify performance in the following Behavior Analysis and Safety Improvement Categories. Modal Carrier Profile 12 Transportation Strategy SCMN 4780 CSA 2010 – Improvement Categories 1. 2. 3. 4. 5. 6. 7. Unsafe Driving - Operation of commercial motor vehicles by drivers in a dangerous or careless manner. Example violations: Speeding, reckless driving, improper lane change, and inattention. Fatigued Driving (Hours-of-Service) - Operation of CMVs by drivers who are ill, fatigued, or in non-compliance with the Hours-of-Service (HOS) regulations. This includes violations of regulations pertaining to logbooks as they relate to HOS requirements and the management of CMV driver fatigue. Example violations: Exceeding HOS, maintaining an incomplete or inaccurate logbook, and operating a CMV while ill or fatigued. Driver Fitness - Operation of CMVs by drivers who are unfit to operate a CMV due to lack of training, experience, or medical qualifications. Example violations: Failure to have a valid and appropriate commercial driver’s and being medically unqualified to operate a CMV. Controlled Substances & Alcohol - Operation of CMVs by drivers who are impaired due to alcohol, illegal drugs, and misuse of prescription or over-the-counter medications. Example violations: Use or possession of controlled substances/alcohol. Vehicle Maintenance - Failure to properly maintain a CMV. Example violations: Brakes, lights, and other mechanical defects, and failure to make required repairs. Cargo-Related - Failure to properly prevent shifting loads, spilled or dropped cargo, overloading, and unsafe handling of hazardous materials on a CMV. Example violations: Improper load securement, cargo retention, and hazardous material handling. Crash Indicator - Histories or patterns of high crash involvement, including frequency and severity. It is based on information from State-reported crashes. Modal Carrier Profile 13 Transportation Strategy SCMN 4780 Truck Driver Profile Modal Carrier Profile 14 Transportation Strategy SCMN 4780 Team Report – Carrier Performance Carrier Report Card • Identify 4 - 5 areas of carrier performance / KPI metrics (mode generic) • Define the metric to be used to calculate performance in each area (mode generic) • Prioritize the importance of each performance area (weighting factor) Modal Carrier Profile 15 Transportation Strategy SCMN 4780 Domestic Truck Freight Statistics ($B) LTL 27 TL 320 LTL is much more concentrated market than TL • Top 25 LTL carriers = 88% of total LTL revenues (top 6 = 50%) • Top 25 TL carriers = < 10% of total TL revenues Modal Carrier Profile 16 Transportation Strategy SCMN 4780 Truckload (TL) Modal Freight • • • • • Shipments typically exceed 20,000 lbs. with weight limitations Freight pickup at shipper and delivery to customer is scheduled Delivery transit times based on distance and driver regulations Carrier selection options are private, common, contract carriers Rates are established by ______________________________ Producer Modal Carrier Profile pickup delivery 17 Customer Transportation Strategy SCMN 4780 Truckload (TL) Freight Modal Carrier Profile 18 Transportation Strategy SCMN 4780 Truckload (TL) Freight 2009 Rev ($ M) COMPANY NAME SUBSIDIARY PORTFOLIO / COMMENTS 1 Swift Transportation Swift Transportation $ 2,338 2 Schneider National Schneider National, Schneider National Bulk Carriers $ 2,200 3 Werner Enterprises One-way Truckload, Dedicated, Cross-Border $ 1,433 4 U.S. Xpress Enterprises US Xpress, Xpress Global Systems, Xpress Direct, Total Transportation, Arnold Transportation, Abilene Motor Express, C&C Transportation, Smith Transport, Pinner Transport $ 1,333 5 J.B. Hunt Transport J.B. Hunt Truck, Dedicated Contract Services $ 1,204 6 Prime Inc. Flatbed, Refrigerated, Tanker $ 992 7 C.R. England England North American, England Mexico, England Dedicated $ 979 8 Crete Carrier Corp. Crete Carrier, Shaffer Trucking, Hunt Transportation $ 849 9 Knight Transportation Knight Transportation, Knight Refrigerated $ 585 10 Ruan Transportation Ruan Dedicated Contract Carriage, Bulk Transportation $ 584 11 CRST International CRST Van Expedited, CRST Malone, CRST Dedicated Services $ 561 12 Covenant Transport Group Covenant Transport, Southern Refrigerated Transport, Star Transportation $ 541 Modal Carrier Profile 19 Transportation Strategy SCMN 4780 Truckload (TL) Freight Market Challenges: • industry profitability with market-driven pricing • owner / operator vs. corporate ownership vs. hybrid ownership • stricter driver regulations / aging workforce • highway conditions • fuel costs Specific Customer Selection / Performance Criteria ? Modal Carrier Profile 20 Transportation Strategy SCMN 4780 Less-Than-Truckload (LTL) Modal Freight pickup Producer Modal Carrier Profile line haul 21 Hub Terminal shipments range from 150 – 20,000 lbs. due to smaller shipment size, costs are less than TL freight rates LTL freight mixed with other shipper loads to gain trailer density freight pickup / delivery is typically by regular driver routes pickup-to-delivery transit times much greater than TL freight rates are established by ________________________________ Hub Terminal • • • • • • delivery Customer Transportation Strategy SCMN 4780 LTL Hub Terminals • LTL competes on transit times • Terminals operations similar to distribution centers • Success of terminal operation requires adopting LEAN principles (cross-docking) • Challenge is to dynamically match-up terminal locations with customer delivery requirements • IT solutions are essential • Modal Carrier Profile 22 Transportation Strategy SCMN 4780 YRC Transit Times – Kansas City, MO Standard Transit Days From Kansas City, MO Modal Carrier Profile 23 Transportation Strategy SCMN 4780 Less-Than-Truckload (LTL) Freight CARRIER NAME 2010 REV ($M) COVERAGE 1 FedEx Freight $ 4,421 Nationwide, Canada, Mexico Non-Union 2 Con-Way Freight $ 3,026 Nationwide, Canada, Mexico Non-Union 3 YRC National $ 2,642 Nationwide, Canada, Mexico Union 4 UPS Freight $ 2,002 Nationwide, Canada, Mexico Union 5 ABF Freight Systems $ 1,395 Nationwide, Canada Union 6 Old Dominion Freight $ 1,377 Nationwide, Canada Non-Union 7 Estes Express Lines $ 1,352 Nationwide Non-Union 8 YRC Regional $ 1,257 Nationwide Union 9 R+L Carriers $ 1,077 Nationwide Non-Union 10 Saia Motor Freight $ 836 Midwest, Southeast Non-Union 11 Southeastern Freight Lines $ 723 Southeast, Southwest Non-Union Modal Carrier Profile 24 Transportation Strategy SCMN 4780 Less-Than-Truckload (LTL) Freight Market Challenges: • stricter driver regulations / aging workforce • highway conditions • fuel costs • investments in technology with questionable ROI • hub terminal locations and operating costs Specific Customer Selection / Performance Criteria ? Modal Carrier Profile 25 Transportation Strategy SCMN 4780


