Genetically modified organisms at population and landscape scales.
advertisement
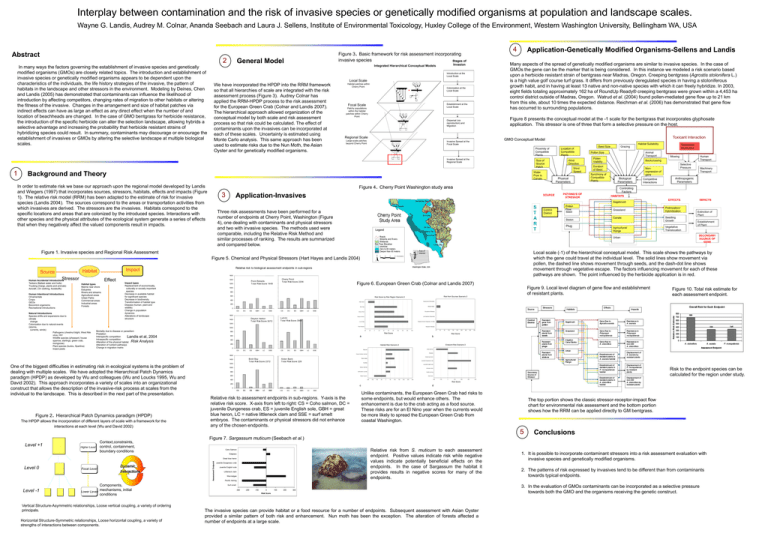
Interplay between contamination and the risk of invasive species or genetically modified organisms at population and landscape scales. Wayne G. Landis, Audrey M. Colnar, Ananda Seebach and Laura J. Sellens, Institute of Environmental Toxicology, Huxley College of the Environment, Western Washington University, Bellingham WA, USA Abstract 2 In many ways the factors governing the establishment of invasive species and genetically modified organisms (GMOs) are closely related topics. The introduction and establishment of invasive species or genetically modified organisms appears to be dependent upon the characteristics of the individuals, the life history strategies of the invasive, the pattern of habitats in the landscape and other stressors in the environment. Modeling by Deines, Chen and Landis (2005) has demonstrated that contaminants can influence the likelihood of introduction by affecting competitors, changing rates of migration to other habitats or altering the fitness of the invasive. Changes in the arrangement and size of habitat patches via indirect effects can have as large an effect as any direct effect when the number of and location of beachheads are changed. In the case of GMO bentgrass for herbicide resistance, the introduction of the specific herbicide can alter the selection landscape, allowing hybrids a selective advantage and increasing the probability that herbicide resistant strains of hybridizing species could result. In summary, contaminants may discourage or encourage the establishment of invasives or GMOs by altering the selective landscape at multiple biological scales. Figure 3. Basic framework for risk assessment incorporating invasive species Stages of General Model Invasion Integrated Hierarchical Conceptual Models Introduction at the Local Scale Local Scale We have incorporated the HPDP into the RRM framework so that all hierarchies of scale are integrated with the risk assessment process (Figure 3). Audrey Colnar has applied the RRM-HPDP process to the risk assessment for the European Green Crab (Colnar and Landis 2007). The hierarchical approach allowed organization of the conceptual model by both scale and risk assessment process so that risk could be calculated. The effect of contaminants upon the invasives can be incorporated at each of these scales. Uncertainty is estimated using Monte Carlo analysis. This same approach has been used to estimate risks due to the Nun Moth, the Asian Oyster and for genetically modified organisms. Habitat patches within Cherry Point Focal Scale Patchy populations within the habitat patches within Cherry Point Colonization at the Local Scale Establishment at the Local Scale Dispersal (via reproduction) and Migration Regional Scale Large-scale patches beyond Cherry Point Invasive Spread at the Focal Scale 4 Application-Genetically Modified Organisms-Sellens and Landis Many aspects of the spread of genetically modified organisms are similar to invasive species. In the case of GMOs the gene can be the marker that is being considered. In this instance we modeled a risk scenario based upon a herbicide resistant strain of bentgrass near Madras, Oregon. Creeping bentgrass (Agrostis stolonifera L.) is a high value golf course turf grass. It differs from previously deregulated species in having a stoloniferous growth habit, and in having at least 13 native and non-native species with which it can freely hybridize. In 2003, eight fields totaling approximately 162 ha of RoundUp Ready® creeping bentgrass were grown within a 4,453 ha control district outside of Madras, Oregon. Watrud et al. (2004) found pollen-mediated gene flow up to 21 km from this site, about 10 times the expected distance. Reichman et al. (2006) has demonstrated that gene flow has occurred to surrounding populations. Figure 8 presents the conceptual model at the -1 scale for the bentgrass that incorporates glyphosate application. This stressor is one of three that form a selective pressure on the host. Habitat Suitability Proximity of Compatible Plants Invasive Spread at the Regional Scale 1 Size of Source Patch Background and Theory Water Flow in Canals 3 Application-Invasives S T A R T Three risk assessments have been performed for a number of endpoints at Cherry Point, Washington (Figure 4), one dealing with contaminants and physical stressors and two with invasive species. The methods used were comparable, including the Relative Risk Method and similar processes of ranking. The results are summarized and compared below. Human Intentional Introductions Ornamentals Crops GEOs Biocontrol organisms Recreational introductions Habitat types Marine near shore Estuaries Rivers and streams Agricultural areas Urban Parks Commercial areas Industrial areas Forests Natural Introductions Species shifts and expansions due to climate change Colonization due to natural events (storms, currents, winds) Pathogens (chestnut blight, West Nile virus, HIV Wildlife species (pheasant, house sparrow, starlings, green crab, mongoose) Plant species (kudzu, Spartina) Insect pests Animal Transport Pollen Viability 1400 Impact types Replacement of economically, culturally or socially important species Decrease in available habitat for significant species Decrease in biodiversity Transformation of habitat type Disease (human. plant and wildlife) Change in population dynamics Alterations of landscape structure Cherry Point Total Ri sk Score 2206 Point Roberts Total Ri sk Score 1449 1200 Control District Pollen Flow Seed Stolon Plug Mowing Human Transport Backcrossing Duration of Seed Selective Pressure Nonexpression of gene Biological Parameters Competitive Interactions Machinery Transport Anthropogenic Parameters Controlling Factors HABITATS EFFECTS Grassland Pollinization/ Hybridization Canals Seedling Growth Agricultural/ Range Vegetative Translocation IMPACTS Extinction of Plant Establishment of Plant SECONDARY SOURCE OF GENE Local scale (-1) of the hierarchical conceptual model. This scale shows the pathways by which the gene could travel at the individual level. The solid lines show movement via pollen, the dashed line shows movement through seeds, and the dash-dot line shows movement through vegetative escape. The factors influencing movement for each of these pathways are shown. The point influenced by the herbicide application is in red. 1600 Effect PATHWAYS OF STRESSOR Pollen Size Synchrony of Compatible Plants Glyphosate Application Grazing Urban Relative risk to biological assessment endpoints in sub-regions Impact Stressor Wind Speed Seed Size Sagebrush Figure 5. Chemical and Physical Stressors (Hart Hayes and Landis 2004) Human Accidental Introductions Tankers (Ballast water and hulls) Trucking (Cargo, plants and animals) Aircraft ( On clothing, foodstuffs) Wind Direction Physical Parameters SOURCE Figure 1. Invasive species and Regional Risk Assessment Habitat Location of Compatible Plants Figure 4. Cherry Point Washington study area In order to estimate risk we base our approach upon the regional model developed by Landis and Wiegers (1997) that incorporates sources, stressors, habitats, effects and impacts (Figure 1). The relative risk model (RRM) has been adapted to the estimate of risk for invasive species (Landis 2004). The sources correspond to the areas or transportation activities from which invasives are derived. The stressors are the invasives. Habitats correspond to the specific locations and areas that are colonized by the introduced species. Interactions with other species and the physical attributes of the ecological system generate a series of effects that when they negatively affect the valued components result in impacts. Source Toxicant Interaction GMO Conceptual Model Figure 6. European Green Crab (Colnar and Landis 2007) Figure 9. Local level diagram of gene flow and establishment of resistant plants. 1000 800 600 Figure 10. Total risk estimate for each assessment endpoint. 400 200 0 CS DC ES GBH LC SSE CS DC ES GBH LC SSE LC SSE 1600 Lum mi Total Ri sk Score 3564 Drayton Harbor Total Ri sk Score 3072 1400 1200 1000 Mortality due to disease or parasitism Predation Interspecific competition Intraspecific competition Alteration of the physical habitat Alteration of nutrient pathways Change in migration matrix 800 Landis et al, 2004 Risk Analysis 600 400 200 0 CS DC ES GBH LC SSE CS DC ES GBH 1600 Birch Bay Total Ri sk Score 2372 1400 Alden Bank Total Ri sk Score 228 1200 One of the biggest difficulties in estimating risk in ecological systems is the problem of dealing with multiple scales. We have adopted the Hierarchical Patch Dynamics paradigm (HPDP) as developed by Wu and colleagues (Wu and Loucks 1995, Wu and David 2002). This approach incorporates a variety of scales into an organizational construct that allows the description of the invasive-risk process at scales from the individual to the landscape. This is described in the next part of the presentation. Figure 2. Hierarchical Patch Dynamics paradigm (HPDP) The HPDP allows the incorporation of different layers of scale with a framework for the interactions at each level (Wu and David 2002) 1000 Risk to the endpoint species can be calculated for the region under study. 800 600 400 200 0 CS DC ES GBH LC SSE Relative risk to assessment endpoints in sub-regions. Y-axis is the relative risk score. X-axis from left to right: CS = Coho salmon, DC = juvenile Dungeness crab, ES = juvenile English sole, GBH = great blue heron, LC = native littleneck clam and SSE = surf smelt embryos. The contaminants or physical stressors did not enhance any of the chosen endpoints. Unlike contaminants, the European Green Crab had risks to some endpoints, but would enhance others. The enhancement is due to the crab acting as a food source. These risks are for an El Nino year when the currents would be more likely to spread the European Green Crab from coastal Washington. The top portion shows the classic stressor-receptor-impact flow chart for environmental risk assessment and the bottom portion shows how the RRM can be applied directly to GM bentgrass. 5 Level +1 Higher Level Context,constraints, control, containment, boundary conditions Figure 7. Sargassum muticum (Seebach et al.) Relative risk from S. muticum to each assessment endpoint. Positive values indicate risk while negative values indicate potentially beneficial effects on the endpoints. In the case of Sargassum the habitat it provides results in negative scores for many of the endpoints. Coho Salmon Eelgrass Level -1 Focal Level Lower Level Dynamic Interactions Components, mechanisms, initial conditions Vertical Structure-Asymmetric relationships, Loose vertical coupling, a variety of ordering principals. Horizontal Structure-Symmetric relationships, Loose horizontal coupling, a variety of strengths of interactions between components. Assessment Endpoint Great blue heron Level 0 Conclusions Juvenile Dungeness crab Juvenile English sole Littleneck clam Macroalgae Pacific herring Surf smelt -300 -200 -100 0 100 200 300 Risk Score The invasive species can provide habitat or a food resource for a number of endpoints. Subsequent assessment with Asian Oyster provided a similar pattern of both risk and enhancement. Nun moth has been the exception. The alteration of forests affected a number of endpoints at a large scale. 1. It is possible to incorporate contaminant stressors into a risk assessment evaluation with invasive species and genetically modified organisms. 2. The patterns of risk expressed by invasives tend to be different than from contaminants towards typical endpoints. 3. In the evaluation of GMOs contaminants can be incorporated as a selective pressure towards both the GMO and the organisms receiving the genetic construct.
