Procedure
advertisement
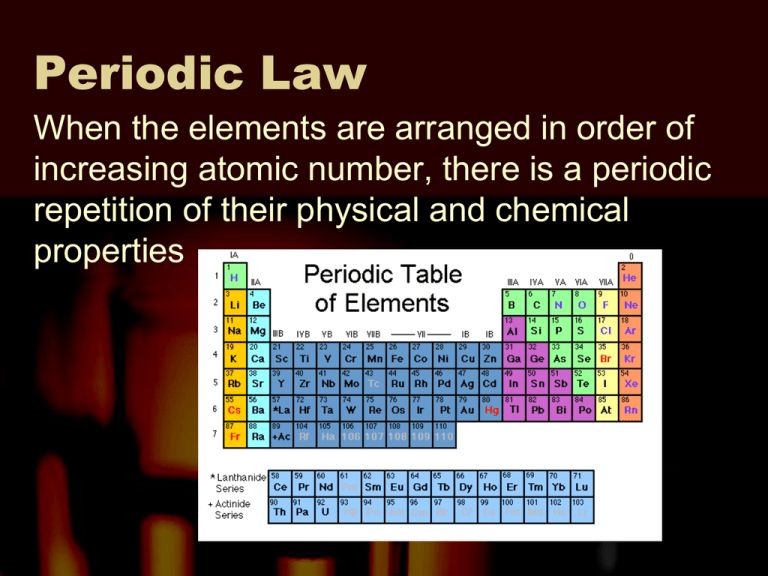
Periodic Law When the elements are arranged in order of increasing atomic number, there is a periodic repetition of their physical and chemical properties Atomic Radius One-half the distance between the nuclei in a molecule consisting of identical atoms Ionization Energy The energy required to remove an electron from a gaseous atom Electronegativity The tendency for an atom to attract electrons to itself when it is chemically combined with another element. Ionic Radius The atomic radius of an ion. The radii of cations and anions decrease from left to right across a period. They increase from top to bottom in a group. Laboratory 2 – Plotting Periodic Trends This is a “dry lab.” This means that you will not be working with any chemicals. You will be taking data that has already been collected and interpreting it. The data you will be interpret will be the known values for the elements for the periodic trends of first ionization energy and atomic radius. Laboratory 2 – Plotting Periodic Trends Procedure – For the laboratory you will make four graphs, then answer four questions. Graph 1 - For elements 3-20 graph atomic radius as a function of atomic number. This means, plot atomic number on the X axis and atomic radius on the Y axis. After creating the graph, use a colored pen or pencil to draw a vertical line that represents that beginning of each period (horizontal row on the periodic table). Laboratory 2 – Plotting Periodic Trends Graph 2 - For elements in Group 1 (Alkali metals), make a graph of atomic radius as a function of atomic number. Make a second line on this same graph that will represent Group 2 (Alkaline Earth Metals). Use a periodic table to determine which elements are members of Group 1 and which elements are members of Group 2. Laboratory 2 – Plotting Periodic Trends Graph 3 - For elements 3-20, make a graph of the energy required to remove the easiest electron (first ionization energy) as a function of atomic number. Plot atomic number on the X axis and energy required on the Y axis. After creating the graph, use a colored pen or pencil to draw a vertical line that represents that beginning of each period (horizontal row on the periodic table). Laboratory 2 – Plotting Periodic Trends Graph 4 - For elements of Group 1 (Alkali metals), make a graph of the energy required to remove the easiest electron (first ionization energy) as a function of atomic number. On the same graph make a second line to represent Group 2 (Alkaline Earth Metals). Use a periodic table to determine which elements are members of Group 1 and which elements are members of Group 2. Laboratory 2 – Plotting Periodic Trends QUESTIONS FOR DISCUSSION: 1. What happens to the atomic radius as the atomic number increases across a period? Down a group? 2. What happens to the energy needed to remove an electron as the atomic number increases across a period? Down a group? 3. Why does atomic radius change as it does? 4. Why does the energy required to remove an electron change as it does?
