section b - Learning
advertisement

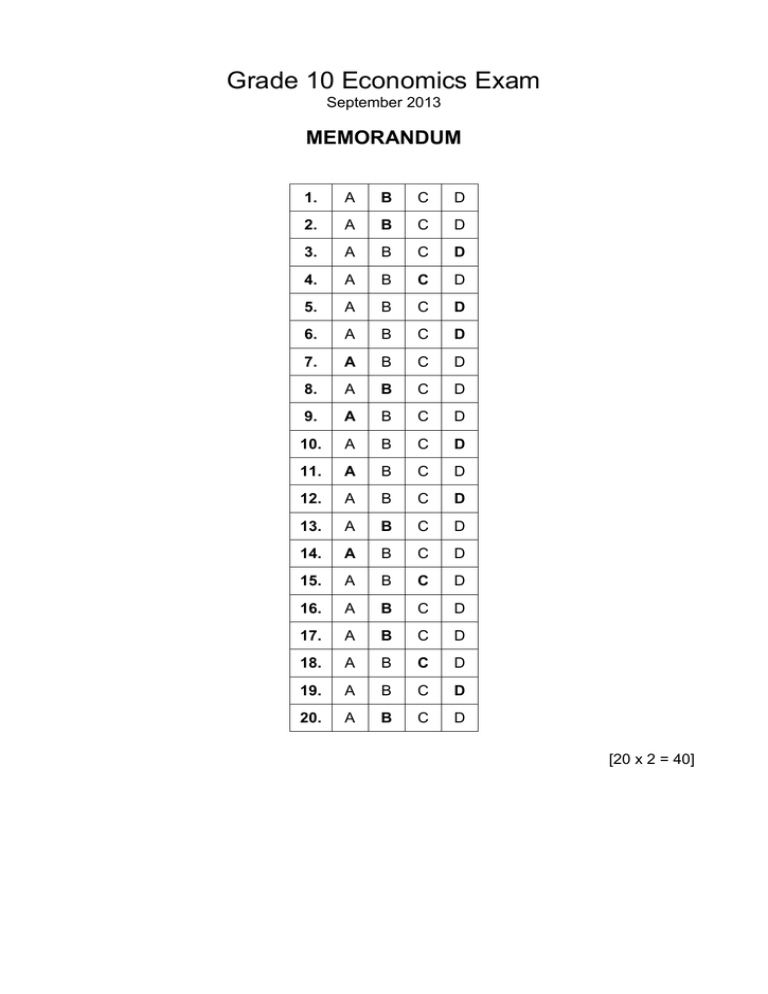
Grade 10 Economics Exam September 2013 MEMORANDUM 1. A B C D 2. A B C D 3. A B C D 4. A B C D 5. A B C D 6. A B C D 7. A B C D 8. A B C D 9. A B C D 10. A B C D 11. A B C D 12. A B C D 13. A B C D 14. A B C D 15. A B C D 16. A B C D 17. A B C D 18. A B C D 19. A B C D 20. A B C D [20 x 2 = 40] SECTION B: DATA RESPONSE START EACH SECTION ON A NEW SHEET OF PAPER. QUESTION 2 The struggles of the Ivory Coast’s cocoa farmers Cocoa prices have hit a 30-year high due to demand exceeding supply. Production of cocoa in the Ivory Coast, which provides about a third of the world’s cocoa beans, has fallen as a result of poor weather and under-investment in the industry. The 2009 harvest was badly affected by dry weather, pests and disease. A spokesperson at the International Cocoa Organisation commented, “We have now had three consecutive years of supply declining. With current production methods, the Ivory Coast has reached maximum output. Farmers don’t use many chemicals and pesticides. They need to invest more in chemicals and other farming techniques to increase their yields.” The demand for cocoa has continued to grow. The fashion for more expensive, high-quality chocolate has helped to increase demand as it typically has a higher cocoa content. A spokesperson from the Fair Trade Association commented, “The large, unpredictable fluctuations in the cocoa market make life extremely difficult for farmers.” The Government of the Ivory Coast is planning to create greater stability in the cocoa market by regulating the industry. It is thinking of selling the cocoa itself and also fixing the price. If the government fixed the price for cocoa, the farmers would be less vulnerable to fluctuations in prices due to changes in demand and supply factors. 2.1 State one reason for the increase in demand for cocoa. (2) One influence on the increase in demand for cocoa: the fashion for more ‘upmarket’ chocolate 2.2 State two reasons for the decrease in supply of cocoa. (4) Two influences on the decrease in supply of cocoa: poor weather (dry weather) under-investment in the industry producers don’t use many chemicals or pesticides they need to invest in other farming techniques pests disease 2.3 Explain, using a demand and supply diagram, how the changes in the demand for and the supply of cocoa have affected the equilibrium price and equilibrium quantity in the cocoa market. (12) Diagram: correctly labelled and drawn axes (P and Q) and curves (D and S) (2) correctly labelled and drawn shift of the demand curve to the right and supply curve to the left (2) change in equilibrium price and equilibrium quantity clearly shown (2) Grade 10 Economics: September 2013 2 Explanation of diagram: shifts of demand and supply curves (2) higher price (2) change in quantity uncertain (2) 2.4 Explain why the large, unpredictable fluctuations in the cocoa market make life difficult for cocoa farmers. (6) Effects of fluctuations in the cocoa market: wild fluctuations in relation to changes in demand and supply conditions, especially in relation to supply these fluctuations likely to lead to volatile prices this will be extremely unstable for farmers – this instability can be very unsettling, making planning uncertain. Variations in prices will lead to variations in incomes – this will affect the standard of living of the farmers 2.5 Discuss whether an economy would benefit from its government intervening to regulate an industry. (16) In favour: establish fixed (minimum or maximum) prices to support an industry may be able to maintain employment levels Against: goes against free market forces could mean that a government is supporting an inefficient industry A one-sided answer can gain no more than 10 marks. TOTAL SECTION B: [40] Grade 10 Economics: September 2013 3 SECTION C ANSWER ONE QUESTION FROM THIS SECTION. START EACH SECTION ON A NEW SHEET OF PAPER. QUESTION 3 3.1 Explain, with the use of diagrams, the different effects on the price and quantity of a product of the removal of a subsidy and the removal of an indirect tax on that product. (16) A subsidy is a grant to producers that lowers their costs of production. Its removal will shift the supply curve to the left and result in a higher price and a lower quantity traded. An indirect tax, e.g. VAT or GST, is levied on goods and services and raises the cost of production. Its removal would shift the supply curve to the right and result in lower price to the consumer with a greater quantity traded. For knowledge and understanding of subsidies and indirect taxes. (8) For an analysis of how the removal of a subsidy and indirect would affect price and quantity of a product. (8) 3.2 Discuss the possible benefits and drawbacks of government subsidies to agriculture. (24) Subsidies lower producer costs and increase output. This benefits consumers who pay lower prices and producers who receive higher incomes. This may be justified in terms of maintaining essential products, supporting lower income groups, preventing dependence on foreign suppliers, improving the balance of trade, retaining a traditional form of life and contributing to environmentally friendly activity that has positive externalities. Subsidies have opportunity costs in terms of alternative government expenditure, may reduce the efficient allocation of resources, may encourage dependence on the state, may reduce producer initiative and may raise taxes with disincentive effects. For knowledge and understanding of the impact of subsidies on costs prices and output. (4) For an analysis of the benefits and drawbacks of subsidies. (12) For an evaluation of the overall impact of subsidies. (8) QUESTION 4 4.1 Explain how income elasticity of demand and cross elasticity of demand can be used to classify different types of goods. (16) Income elasticity can relate to inferior good where there is a reduction in demand as consumer income rises e.g. bus travel. This would have a negative income elasticity of demand (YED) as Y rises QD falls. Cross elasticity of demand can relate to complementary goods that is consumed in conjunction with another product e.g. bread and butter. There will be a negative cross Grade 10 Economics: September 2013 4 elasticity of demand (XED) as a rise in the price of one good causes a fall in the demand for the complement. It can also identify substitute or alternative goods e.g. Pepsi-Cola and Coca-Cola where cross elasticity will be positive. Candidates may offer the formulas. For knowledge and understanding of income elasticity and cross elasticity. (8) For application to different types of goods. (8) 4.2 Discuss the effectiveness of government use of maximum and minimum prices to help consumers and producers. (24) A maximum/minimum price intends to keep prices below/above the market level. The former would benefit consumers, the latter producers. Maximum prices will be ignored and ineffective if set above the market price and minimum will not work if below the market price. A maximum price will benefit those consumers who manage to buy the good but will create a shortage at the set price. This will require government intervention to allocate the restricted supply among the would-be consumers but may result in illegal, black markets that favour the richer consumer. A minimum price will cause an excess supply that will require government action such as storage or destruction with its associated costs. It will favour the producer at the expense of the consumer and taxpayer. Both policies conflict with the market outcome. For knowledge and understanding of the motives for the setting of government prices. (4) For an analysis of the outcome of maximum and minimum prices. (16) (Only one type of government controlled price 12 max) For overall evaluative comment on ‘effectiveness’ of government prices. (4) QUESTION 5 5.1 Explain how the law of diminishing marginal utility might be used to construct a consumer’s demand curve for a product. (16) Explanation of diminishing marginal utility (DMU) and its link to equilibrium price and through changes in price to the demand curve. For a sound discussion with good explanation of the analysis and a clear understanding with a conclusion [14–16] For a thorough explanation but with limited development of the analysis and a weaker conclusion. [9–13] For a brief explanation and with a weak explanatory link between DMU, changes in price and hence the demand curve [4–8] For an answer which has some basic correct facts but includes irrelevancies. Errors of theory or omissions of analysis will be substantial. [0–3] Grade 10 Economics: September 2013 5 5.2 Analyse how budget lines may be used to illustrate what happens for both a normal good and an inferior good when the price of the good increases at the same time as a consumer’s income increases. (24) Budget lines can show what happens to the relationship between the two goods. Income rises will shift the budget line in a parallel manner; price rises of one good will shift the budget line towards the origin for that good. The balance of the two changes will vary for a normal and inferior good but what precise quantity of each will be bought before and after the changes cannot be estimated from the budget line alone. Learners could explain that the quantity purchased would fall for an inferior good if income increases For a sound discussion with good explanation of the analysis and a clear understanding of the different shifts with a conclusion [18–24] For a thorough explanation but with limited development of the analysis and a weaker conclusion. [12–17] For a brief explanation and with a weak explanatory link between budget lines and quantity bought and with no conclusion. [7–11] For an answer which has some basic correct facts but includes irrelevancies. Errors of theory or omissions of analysis will be substantial. [0–6] TOTAL SECTION C: [40] GRAND TOTAL: [120] Grade 10 Economics: September 2013 6


