dynpos~1 - National Optical Astronomy Observatory
advertisement

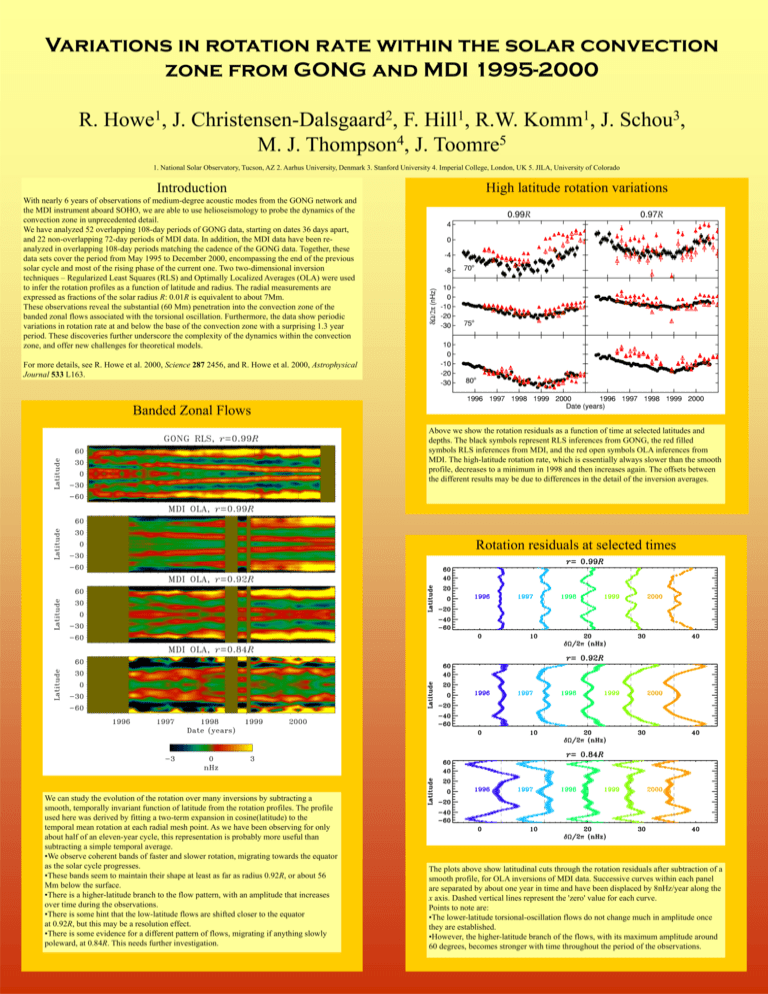
Variations in rotation rate within the solar convection zone from GONG and MDI 1995-2000 R. 1 Howe , J. 2 Christensen-Dalsgaard , 1 Hill , F. R.W. 4 5 M. J. Thompson , J. Toomre 1 Komm , J. 3 Schou , 1. National Solar Observatory, Tucson, AZ 2. Aarhus University, Denmark 3. Stanford University 4. Imperial College, London, UK 5. JILA, University of Colorado Introduction High latitude rotation variations With nearly 6 years of observations of medium-degree acoustic modes from the GONG network and the MDI instrument aboard SOHO, we are able to use helioseismology to probe the dynamics of the convection zone in unprecedented detail. We have analyzed 52 overlapping 108-day periods of GONG data, starting on dates 36 days apart, and 22 non-overlapping 72-day periods of MDI data. In addition, the MDI data have been reanalyzed in overlapping 108-day periods matching the cadence of the GONG data. Together, these data sets cover the period from May 1995 to December 2000, encompassing the end of the previous solar cycle and most of the rising phase of the current one. Two two-dimensional inversion techniques – Regularized Least Squares (RLS) and Optimally Localized Averages (OLA) were used to infer the rotation profiles as a function of latitude and radius. The radial measurements are expressed as fractions of the solar radius R: 0.01R is equivalent to about 7Mm. These observations reveal the substantial (60 Mm) penetration into the convection zone of the banded zonal flows associated with the torsional oscillation. Furthermore, the data show periodic variations in rotation rate at and below the base of the convection zone with a surprising 1.3 year period. These discoveries further underscore the complexity of the dynamics within the convection zone, and offer new challenges for theoretical models. For more details, see R. Howe et al. 2000, Science 287 2456, and R. Howe et al. 2000, Astrophysical Journal 533 L163. Banded Zonal Flows Above we show the rotation residuals as a function of time at selected latitudes and depths. The black symbols represent RLS inferences from GONG, the red filled symbols RLS inferences from MDI, and the red open symbols OLA inferences from MDI. The high-latitude rotation rate, which is essentially always slower than the smooth profile, decreases to a minimum in 1998 and then increases again. The offsets between the different results may be due to differences in the detail of the inversion averages. Rotation residuals at selected times We can study the evolution of the rotation over many inversions by subtracting a smooth, temporally invariant function of latitude from the rotation profiles. The profile used here was derived by fitting a two-term expansion in cosine(latitude) to the temporal mean rotation at each radial mesh point. As we have been observing for only about half of an eleven-year cycle, this representation is probably more useful than subtracting a simple temporal average. •We observe coherent bands of faster and slower rotation, migrating towards the equator as the solar cycle progresses. •These bands seem to maintain their shape at least as far as radius 0.92R, or about 56 Mm below the surface. •There is a higher-latitude branch to the flow pattern, with an amplitude that increases over time during the observations. •There is some hint that the low-latitude flows are shifted closer to the equator at 0.92R, but this may be a resolution effect. •There is some evidence for a different pattern of flows, migrating if anything slowly poleward, at 0.84R. This needs further investigation. The plots above show latitudinal cuts through the rotation residuals after subtraction of a smooth profile, for OLA inversions of MDI data. Successive curves within each panel are separated by about one year in time and have been displaced by 8nHz/year along the x axis. Dashed vertical lines represent the 'zero' value for each curve. Points to note are: •The lower-latitude torsional-oscillation flows do not change much in amplitude once they are established. •However, the higher-latitude branch of the flows, with its maximum amplitude around 60 degrees, becomes stronger with time throughout the period of the observations. Variations near the tachocline The Global Picture Cutaway view (left) and radial cuts (right) of mean rotation, from RLS inversion of GONG data. The color scale in the cutaway view has red as fast rotation, blue as slow. The rotation is approximately constant on radial lines within the convection zone, with a shear layer in the outer 5% by radius. At the base of the convection zone (0.71R) is a transition region (the tachocline) below which rotation is approximately uniform. The plots above show variations in the rotation-rate residuals at selected radii and latitudes close to the base of the Convection Zone. Black circles represent GONG and red triangles MDI data, with RLS inferences shown as filled and OLA as open symbols. We have now analyzed about a year of data beyond that shown by Howe et al. (2000b), and both the oscillatory signal at 0.72R at the equator, and the agreement between GONG and MDI results, appear to persist. Variations near the tachocline – 108-day sets With different temporal sampling in the MDI and GONG data, it was difficult to compare the results directly. The MDI data were therefore re-analyzed in the same 108day cadence used for the GONG data. The agreement at 0.72R at the equator remains good, at least in the RLS inversions. The more erratic variations at 60 degrees latitude are less well reproduced. The periodic nature of the signal can be assessed by fitting sine wave functions, y=a1 cos(2t)+a2 sin(2t) to the data. The plots above show (A) the best-fit sine wave (frequency 0.77±0.1 y-1) superimposed on the GONG RLS data, (B) the power spectrum at 0.72 R, 0º, (C) power at 0.77 y-1 at 0º as a function of radius. Notice the secondary peak in power at 0.63R. This work utilizes data obtained by the Global Oscillation Network Group (GONG) project, managed by the National Solar Observatory, which is operated by AURA, Inc. under a cooperative agreement with the National Science Foundation. The data were acquired by instruments operated by the Big Bear Solar Observatory, High Altitude Observatory, Learmonth Solar Observatory, Udaipur Solar Observatory, Instituto de AstrofÍsico de Canarias, and Cerro Tololo Interamerican Observatory. SOHO is a joint project of ESA and NASA. This work was supported in part by the UK Particle Physics and Astronomy Research Council. MJT thanks the Theoretical Astrophysics Center, Denmark, for hospitality and financial support. Above, we illustrate the continuing difficulty of obtaining the oscillatory signal directly from the short, interrupted time series of the MDI data. In the top panel, we plot the RLS rotation residuals at 0.72R at the equator, with black symbols for GONG and red for MDI. The open symbols represent the GONG data with no corresponding MDI data, and the dashed line the best sine wave fit to the whole GONG data sequence. The lower left panel shows the relationship between corresponding residuals for GONG and MDI. In the lower right panel, the GONG power spectrum for the common data set is plotted in black and the MDI one in red. With this temporal sampling, neither data set shows a clean single peak, but the spectra for MDI and GONG are similar, with a slightly smaller amplitude for MDI.


