PowerPoint - Texas A&M University
advertisement

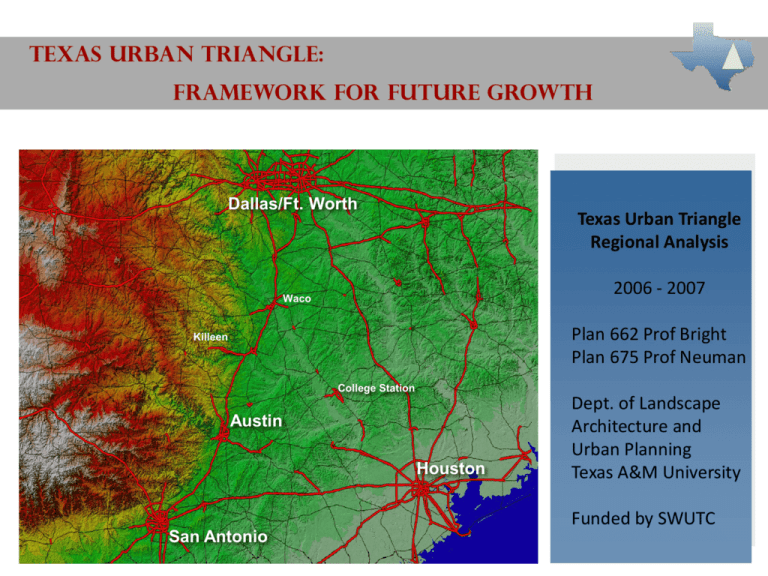
TEXAS URBAN TRIANGLE: FRAMEWORK FOR FUTURE GROWTH Dallas/Ft. Worth Texas Urban Triangle Regional Analysis 2006 - 2007 Waco Plan 662 Prof Bright Plan 675 Prof Neuman Killeen College Station Austin Houston Dept. of Landscape Architecture and Urban Planning Texas A&M University Funded by SWUTC San Antonio TEXAS URBAN TRIANGLE AT NIGHT San Antonio Stephen F. Austin State University RESEARCH TEAM - FACULTY Michael Neuman, Department of Landscape Architecture and Urban Planning Texas A&M University Elise Bright, Department of Landscape Architecture and Urban Planning Texas A&M University Douglas Wunneburger, Department of Landscape Architecture and Urban Planning Texas A&M University David Ellis, Texas Transportation Institute Jose Gavinha, Department of Geography Texas A&M University Eric Dumbaugh, Department of Landscape Architecture and Urban Planning Texas A&M University * Chris Ellis, formerly, Department of Landscape Architecture and Urban Planning Texas A&M University * * advisory RESEARCH TEAM - students Plan 662 Plan 675 Ernest Nortey – Urban Planning Brent Bassett – Civil Engineering Jacob Browning – Urban Planning Cameron Muhic – Urban Planning Jennifer Opon – Urban Planning Chris Wynveen – Rec., Parks & Tourism Juton Hortsman – Urban Planning Cristin Burton – Urban Planning Leslie Lutz – Urban Planning Joe Seitzer – Architecture Luis Estevez – Urban Planning Munmun Parmar – Urban Planning Matthew Hilgemeier – Urban Planning Neethi Rajagopalan – Civil Engineering Michelle Audenaert – Urban Planning Omkar Gupta – Urban Planning Shelanski White – Urban Planning Pamela Hile Chen – Architecture Tamara Palma – Urban Planning Sheena Arora – Landscape Architecture Tony Topping – Urban Planning Subrity Rajbhandari – Urban Planning Xiaoyu Zhang – Urban Planning Professor Elise Bright Professor Michael Neuman Previous and ongoing research • Christopher Ellis, et al. (Texas A&M University) - “Texas Urban Triangle: Working Toward Sustainable New Communities” - 1999 • Texas Department of Transportation – “Crossroads of the Americas: TransTexas Corridor Plan” - 2003 • Federal Reserve Bank of Dallas – “The Texas Triangle as Megalopolis” and “The Economics of the Texas Urban Triangle” - 2004 • Regional Plan Association – “Dancing Through the Scales: From Region to Mega-Region” – 2004 • Robert Lang and Dawn Dhavale (Virginia Tech University) – “Beyond Megalopolis: Exploring America’s New ‘Megalopolitan’ Geography” - 2005 • Jose Gavinha (Texas A&M University) – “Globalization and the Texan Metropolises: Competition and Complementarity in the T.U.T.” - 2007 Previous and ongoing proposals Trans Texas Corridor Dallas/Fort Worth Austin Houston San Antonio Previous and ongoing projects Trans Texas Corridor Dallas/Fort Worth Austin Houston San Antonio Previous and ongoing research Regional Plan Association / University of Pennsylvania, 2004 Urban mega-regions identified by the University of Pennsylvania, School of Design Previous and ongoing research Robert Lang – Virginia Tech University, Metropolitan Institute, 2005 Megapolitan Region Megapolitan Regions (2005) Anchor Metros Signature Industry Cascadia Seattle Portland Aerospace Florida Peninsula Miami Orlando Tourism Front Range Denver Colorado Springs Telecom Great Lakes Crescent Chicago Detroit Manufacturing Gulf Coast Houston Energy I-35 Corridor Dallas Austin High Tech Megalopolis New York Washington, D.C Finance NorCal San Francisco Sacramento High Tech Piedmont Atlanta Charlotte Consumer Banking SoCal Los Angeles Las Vegas Entertainment Sun Corridor Phoenix Tucson Home Building TEXAS URBAN TRIANGLE Counties, 2007 Source: Gavinha (2007) TEXAS COUNTY PEAK POPULATIONS, 1990 - 2000 Source: Gavinha (2007) TEXAS URBAN TRIANGLE population Change, 1990 - 2000 Source: Gavinha (2007) TEXAS URBAN TRIANGLE population DISTRIBUTION, 1990 - 2000 Source: Gavinha (2007) Previous and ongoing research Comparing the TX Urban Triangle to other American metropolises CSA’s, 2007 Total CSA Population Total Personal Income (MSA only) Billions of Dollars Per Capita Personal Income (MSA only) $ New York 21,961,994 1,005 53,423 Los Angeles 17,755,322 539 41,875 Chicago 9,745,165 416 43,714 Baltimore -Washington 8,241,912 287 54,211 Boston 7,476,689 241 53,763 San Francisco - San Jose 7,264,887 257 61,337 Philadelphia 6,385,461 264 45,460 16,548,737 683 35,542 Texas Triangle Census Bureau, Population Division and Bureau of Economic Analysis Previous and ongoing research Comparing the TX Urban Triangle metropolises, 2007 Total Population Total Personal Income, Millions of Dollars Annual Per Capita Personal Income, Dollars Dallas – Fort Worth 6,144,489 256,943 41,813 Houston 5,629,127 260,213 46,235 San Antonio 1,997,969 68,239 34,279 Austin 1,593,400 59,958 37,517 Bryan / College Station 207,734 5,448 26,790 Texas Urban Triangle 16,548,737 682,903 35,542 2007 Census Bureau, Bureau of Economic Analysis Previous and ongoing research TX Urban Triangle Metropolitan Population 1940 – 2030 Austin DFW Houston SA U.S. Bureau of Census (1950-2000) and Office of the State Demographer (2030) TEXAS URBAN TRIANGLE as a proportion of Texas, 2007 100% 90% 80% 70% 60% Rest of Texas 50% TUT 40% 30% 20% 10% 0% Area Population Employment Source: United States Bureau of Census (2008) Wages TEXAS URBAN TRIANGLE racial composition, 2030 Source: Hilgemeier (2007) TEXAS URBAN TRIANGLE AGE composition, 2000 – 2030 Estimated population of the Texas Urban Triangle by age group, 2000-2030 Source: Hilgemeier (2007) FARMING AND URBAN DEVELOPMENT, 1992 - 1997 CHANGE IN NON-DEVELOPED RURAL LAND VALUES, 1992 - 2001 ) Source: Wilkins, et al. (2003) ESTIMATED TOTAL WATER LEVEL DECLINES IN MAJOR AQUIFERS, 2007 Source: 2007 State Water Plan LAND SUBSIDENCE IN EAST TEXAS, 1906 - 1987 LAND SUBSIDENCE IN HOUSTON, 1906 - 2000 PROJECTED LAND SUBSIDENCE IN HOUSTON, 1987 - 2025 Surface -Land Subs ide nce 18.000 16.000 Zone 1 14.000 12.000 Zone 3 Zone 4 10.000 Zone 5 Zone 6 8.000 Zone 7 6.000 Zone 8 Zone 9 4.000 Zone 10 2.000 Ye ar 20 25 20 15 20 05 19 95 0.000 19 87 Subsidence (Feet) Zone 2 Source: Lutz (2007). TROPICAL STORM ALLISON 2001 WATER CONSUMPTION BY TYPE, 1996 WATER CONSUMPTION BY TYPE IN THE TEXAS URBAN TRIANGLE, 1996 3.0 industrial irrigation 2.5 million acre-feet of water municipal other 2.0 1.5 1.0 0.5 - D-FW H-B SA-A other TUT Source: Texas Water Development Board. PROJECTED WATER DEMAND, 2010 - 2060 Texas Water Development Board 2006 Regional Water Plan, Austin, TX; 2006 Texas Water Development Board 2006 Regional Water Plan, Austin, TX; 2006 Source: Texas Water Development Board, 2006 Regional Water Plan. PUBLIC WATER SUPPLIES SYSTEMS AFFECTED BY DROUGHT, SUMMER 2007 NUMBER OF CONFIRMED CONTAMINATED GROUNDWATER CASES IN TEXAS, 2000 NUMBER OF CONFIRMED CONTAMINATED GROUNDWATER CASES IN TEXAS, 1997 350 TUT number of cases 300 rest of state 250 200 150 100 50 0 D-FW Source:TCPS, 2000. H-B SA-A other TUT East Texas South Texas West Texas TEXAS URBAN TRIANGLE Industrial Waste Disposal Sites HURRICANE RISK ZONES & HAZARDOUS MATERIALS FACILITIES Legend HazardousWasteSites2004 RadioactiveWasteSites2000 SuperfundSites2004 Hurricane Risk Zones 1 2 3 4 5 SUBSIDENCE RISK ZONES & HAZARDOUS MATERIALS FACILITIES, 1906 - 1987 Legend HazardousWasteSites2004 RadioactiveWasteSites2000 SuperfundSites2004 Subsidence Risk Zones 1 2 3 4 5 6 7 8 9 10 Total feet from 1906 to 1987 TROPICAL STORM TRACKS & HAZARDOUS MATERIALS FACILITIES AllTropical-Subtropical Storm Tracks with Hazardous Materials Facilities Legend Hurricanes from 1851-2001 ALICIA ALLEN BEULAH BONNIE BRET CARLA CELIA CHANTAL CINDY DEBRA JERRY NOT NAMED Tropical-Subtropical StormTracks Hazardous Waste Sites 2004 Radioactive Waste Sites 2000 Superfund Sites 2004 TEXAS URBAN TRIANGLE Rail Freight Through Texas, 1999 TEXAS URBAN TRIANGLE Texas Freight Rail Lines Dallas/Fort Worth Austin Houston San Antonio TEXAS URBAN TRIANGLE Rail Commodity Flows in Texas, 2000 Dallas/Fort Worth Austin Houston San Antonio TEXAS URBAN TRIANGLE Current Amtrak Routes Route Station FY95 FY00 FY04 Texas Eagle San Antonio - Dallas 80,617 112,444 138,978 Sunset Limited San Antonio- - Houston - Beaumont 51,696 35,055 33,015 132,313 147,499 171,993 TUT Total Source: Amtrak, Department of Government Affairs. TEXAS URBAN TRIANGLE TEXAS URBAN TRIANGLE Austin – San Antonio Commuter Rail Corridor Plan, 2005 TEXAS URBAN TRIANGLE Scheduled Bus Network Dallas/Fort Worth Austin Houston San Antonio TEXAS URBAN TRIANGLE Forecasted VMTs in Selected Counties, 2000 - 2025 Source: Forecast prepared by Cambridge Systematics TEXAS URBAN TRIANGLE Forecasted VMTs on Inter-City Corridors, 2000 - 2025 Source: Forecast prepared by Cambridge Systematics OZONE NON-ATTAINMENT RATINGS, 2006 (EPA) TEXAS AND UNITED STATES Energy Consumption Per Capita Energy Consumption, 2003 U. S. Energy Information Administration (2004) Policy and planning implications •County and Regional Planning •Urban Growth Management •High Speed Rail and Local Mass Transit •Regional and Green Infrastructure Networks •Infrastructure Financing •Water Policy •Farmland Preservation


