GCSE Transformations of Curves Worksheet
advertisement
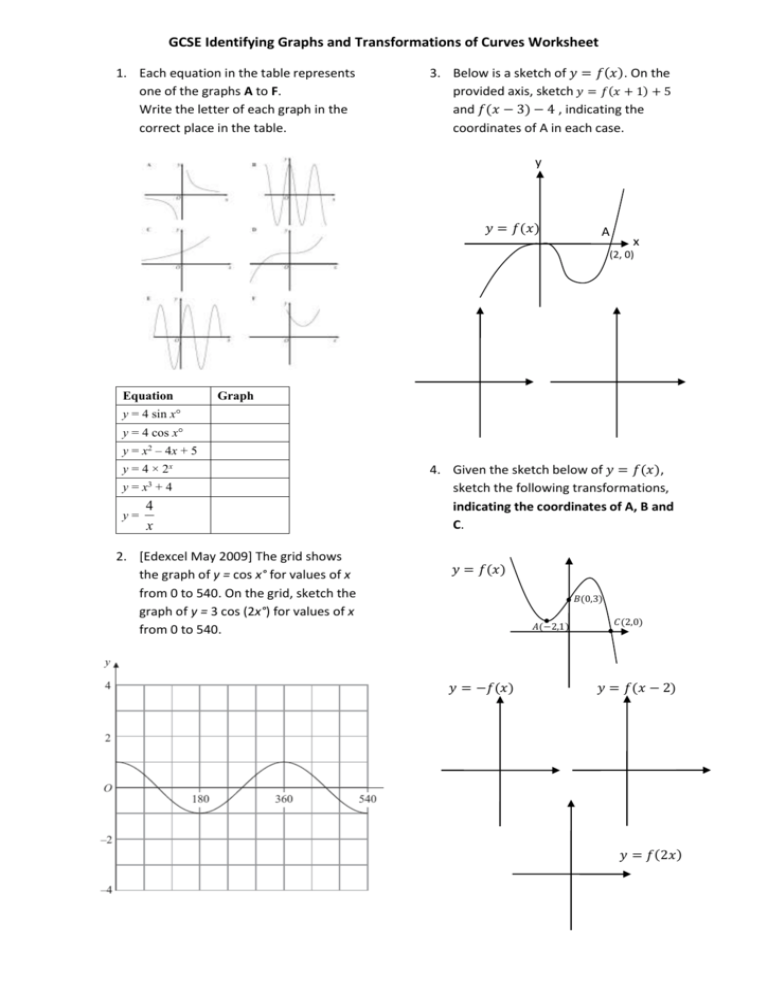
GCSE Identifying Graphs and Transformations of Curves Worksheet 1. Each equation in the table represents one of the graphs A to F. Write the letter of each graph in the correct place in the table. 3. Below is a sketch of 𝑦 = 𝑓(𝑥). On the provided axis, sketch 𝑦 = 𝑓(𝑥 + 1) + 5 and 𝑓(𝑥 − 3) − 4 , indicating the coordinates of A in each case. y 𝑦 = 𝑓(𝑥) A x (2, 0) Equation Graph y = 4 sin x° y = 4 cos x° y = x2 – 4x + 5 y = 4 × 2x 3 y=x +4 y= 4 x 2. [Edexcel May 2009] The grid shows the graph of y = cos x° for values of x from 0 to 540. On the grid, sketch the graph of y = 3 cos (2x°) for values of x from 0 to 540. 4. Given the sketch below of 𝑦 = 𝑓(𝑥), sketch the following transformations, indicating the coordinates of A, B and C. 𝑦 = 𝑓(𝑥) 𝐵(0,3) 𝐴(−2,1) 𝑦 = −𝑓(𝑥) 𝐶(2,0) 𝑦 = 𝑓(𝑥 − 2) 𝑦 = 𝑓(2𝑥) 5. For the given functions 𝑦 = 𝑓(𝑥), sketch the transformed function on the same axis. 𝑦 2 6. 𝑦 2 2 𝑥 Sketch 𝑦 = 𝑓(𝑥) + 1 2 𝑥 Match the following equations to the following features (some features might match multiple equations). Indicate your answer by connecting the two with a line. y = x2 Has a y-intercept of 1. y = 5x Has a y-intercept of 8. y = 2x + 1 Has a line of symmetry. Sketch 𝑦 = 𝑓(2𝑥) y = x3 + x2 – 10x + 8 𝑦 𝑦 y = x2 + 3 y = 2/x 2 𝑥 Sketch 𝑦 = 𝑓(𝑥 − 1) 2 𝑥 Crosses or touches the x-axis. 𝑦 2 𝑥 Sketch 𝑦 = 𝑓(−𝑥) − 1 2 𝑥 Sketch 𝑦 = −𝑓(𝑥 + 1) 𝑦 𝑦 2 Sketch 𝑦 = 𝑓(2𝑥) − 1 𝑥 Is parallel to the line 2x - 3. Is straight. Sketch 𝑦 = 2𝑓(𝑥) 𝑦 Has an asymptote at y=0 2 Sketch 𝑦 = −𝑓(−𝑥) 𝑥 ANSWERS 1. Each equation in the table represents one of the graphs A to F. Write the letter of each graph in the correct place in the table. 3. Below is a sketch of 𝑦 = 𝑓(𝑥). On the provided axis, sketch 𝑦 = 𝑓(𝑥 + 1) + 5 and 𝑓(𝑥 − 3) − 4 , indicating the coordinates of A in each case. y 𝑦 = 𝑓(𝑥) A x (2, 0) A(1, 5) Equation Graph y = 4 sin x° E y = 4 cos x° B y = x – 4x + 5 F 2 x C y = x3 + 4 D 4 y= x A y=4×2 2. [Edexcel May 2009] The grid shows the graph of y = cos x° for values of x from 0 to 540. On the grid, sketch the graph of y = 3 cos (2x°) for values of x from 0 to 540. A(5, -4) 4. Given the sketch below of 𝑦 = 𝑓(𝑥), sketch the following transformations, indicating the coordinates of A, B and C. 5. For the given functions 𝑦 = 𝑓(𝑥), sketch the transformed function on the same axis. 𝑦 2 𝑦 = 𝑓(𝑥) 𝑦 2 𝐵(0,3) 𝐴(−2,1) 2 𝐶(2,0) 𝑥 Sketch 𝑦 = 𝑓(𝑥) + 1 𝑦 = −𝑓(𝑥) 𝑦 = 𝑓(𝑥 − 2) 𝐴(−2, −1) 𝑥 2 𝑥 2 𝑥 Sketch 𝑦 = 𝑓(2𝑥) 𝑦 𝐵(2,3) 𝐶(2,0) 2 𝑦 2 𝑥 𝐴(0,1) 𝐶(4,0) 𝐵(0, −3) Sketch 𝑦 = 𝑓(𝑥 − 1) Sketch 𝑦 = 2𝑓(𝑥) 𝐵(0,3) 𝑦 𝑦 𝑦 = 𝑓(2𝑥) 𝐴(−1,1) 𝐶(1,0) 2 𝑥 Sketch 𝑦 = 𝑓(−𝑥) − 1 Sketch 𝑦 = −𝑓(𝑥 + 1) 𝑦 𝑦 2 Sketch 𝑦 = 𝑓(2𝑥) − 1 𝑥 2 Sketch 𝑦 = −𝑓(−𝑥) 𝑥 6. Match the following equations to the following features (some features might match multiple equations). Indicate your answer by connecting the two with a line. y = x2 Has a y-intercept of 1. y = 5x Has a y-intercept of 8. y = 2x + 1 Has a line of symmetry. y = x3 + x2 – 10x + 8 y = x2 + 3 y = 2/x Has an asymptote at y=0 Is parallel to the line 2x - 3. Is straight. Crosses or touches the x-axis.


