Wind Efficiency Introduction: Wind mills work by its blades
advertisement
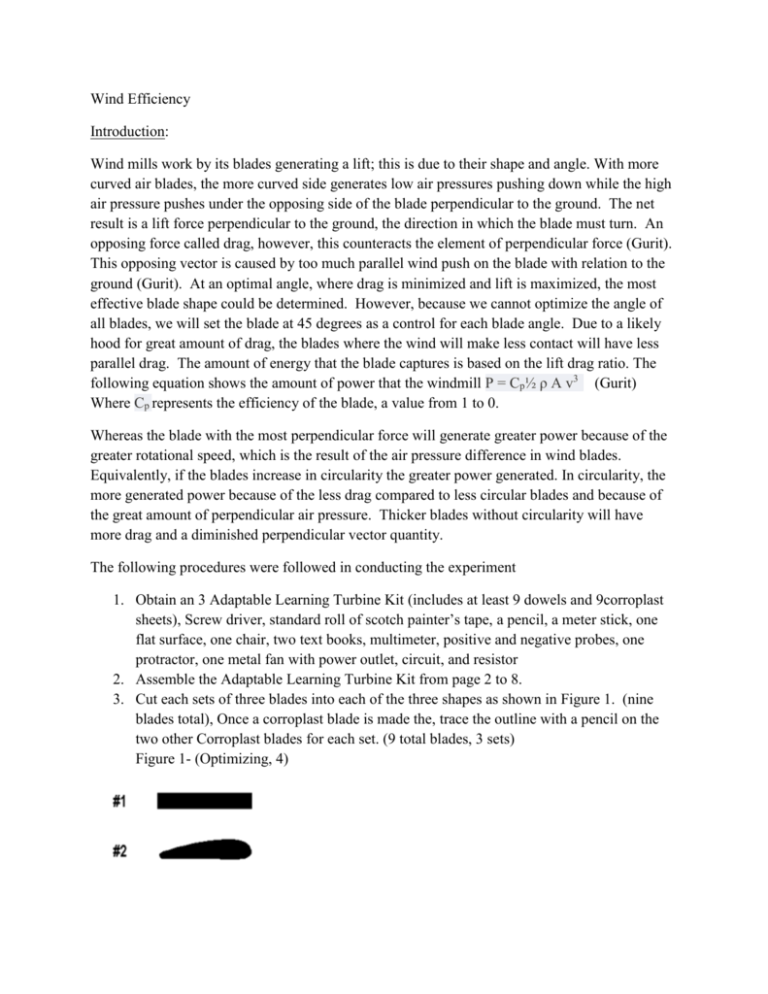
Wind Efficiency Introduction: Wind mills work by its blades generating a lift; this is due to their shape and angle. With more curved air blades, the more curved side generates low air pressures pushing down while the high air pressure pushes under the opposing side of the blade perpendicular to the ground. The net result is a lift force perpendicular to the ground, the direction in which the blade must turn. An opposing force called drag, however, this counteracts the element of perpendicular force (Gurit). This opposing vector is caused by too much parallel wind push on the blade with relation to the ground (Gurit). At an optimal angle, where drag is minimized and lift is maximized, the most effective blade shape could be determined. However, because we cannot optimize the angle of all blades, we will set the blade at 45 degrees as a control for each blade angle. Due to a likely hood for great amount of drag, the blades where the wind will make less contact will have less parallel drag. The amount of energy that the blade captures is based on the lift drag ratio. The following equation shows the amount of power that the windmill P = Cp½ ρ A v3 (Gurit) Where Cp represents the efficiency of the blade, a value from 1 to 0. Whereas the blade with the most perpendicular force will generate greater power because of the greater rotational speed, which is the result of the air pressure difference in wind blades. Equivalently, if the blades increase in circularity the greater power generated. In circularity, the more generated power because of the less drag compared to less circular blades and because of the great amount of perpendicular air pressure. Thicker blades without circularity will have more drag and a diminished perpendicular vector quantity. The following procedures were followed in conducting the experiment 1. Obtain an 3 Adaptable Learning Turbine Kit (includes at least 9 dowels and 9corroplast sheets), Screw driver, standard roll of scotch painter’s tape, a pencil, a meter stick, one flat surface, one chair, two text books, multimeter, positive and negative probes, one protractor, one metal fan with power outlet, circuit, and resistor 2. Assemble the Adaptable Learning Turbine Kit from page 2 to 8. 3. Cut each sets of three blades into each of the three shapes as shown in Figure 1. (nine blades total), Once a corroplast blade is made the, trace the outline with a pencil on the two other Corroplast blades for each set. (9 total blades, 3 sets) Figure 1- (Optimizing, 4) 4. Then tape dowels to the end of each of the blades so that the dowel is secured to the back of each blade. Leave 5 centimeters of dowel at the end of each blade. Also tape the dowel to the back of the blade, so that the end of the blade is perpendicular to the hub. 5. Next insert each blade of each set into their hubs with the dowel, respectively for each blade shape. Insert each 120 degrees apart from each other around the hub. Use the protractor against the hub to angle each blade 45degrees, each in the same direction. Secure the hub with the blades attached in each. 6. Then hook the multimeter appropriately to the generator with the positive and negative probes. Set the multimeter to test voltage first. Note: Important to start at 200V then gradually down to 20V. With Amperage, set the resistor to 200 ohms then down acoordingly 7. First set the multimeter to 20V before staring the fan 8. Place the base of the fan on a chair and adjust so that the fan is in balance. The center of the hub holder on the base of the fan should be level with the center of the fan. The fan blades on the windmill blades should be facing directly at each other, parallel to eachother. 9. Put each blade hub in the hub connector to the base so that its parallel to the windmill blades. 10. Connect a resistor to a circuit board so that volts per ohms can be tested. Make a series circuit with one resistor connection. 11. First testing volts, then ohms, set the metal fan to lowest setting. Test for each blade type three times each. Figure 2- Lab apparatus (showing before Design #2 trial #3 with multimeter hooked up to windmill that is generating power. The metal fan, when turned on generate the white blades to move.) In order test the experiment solely on blade design, the following controls will be set in the experiment: The windmill will be the same length away from the fan each time. The wind will be coming in at a 90 degree angle each time, the intensity of the fan is this is so that different air flows are not a factor. Other controls include that the base of the wind mill, the hinges, and the electric generator are all kept the same throughout the experiment. The only thing that should be changed from each step is the different blade hubs with the different blade designs. Each of the angles of the blades is kept the same. The material of the blade is kept the same. The experiment was done in a closed, wind-free environment. When cutting the blade material, make sure that length In the data processing, We cannot accurately predict the power generated from the blade because of an inability to measure the velocity of the wind and its density. The following equation shows the amount of power that the windmill P = Cp½ ρ A v3 Where Cp represents the efficiency of the blade, a value from 1 to 0. We do not have proper instrumentation to calculate outcome, and moreso % error. Data Collection: Figure 3- Observations Design #1 The blade is spinning faster than other Designs, yet considerably low power generation. Resistance Design #2 Blade spinning at consistent rate, no wobble, hub detached after the last trial. Noticeably varying resistance reading. Design #3 Blades spinning at consistent rate. blade is spinning around the same rate as the other designs. The multimeter did not measurement of uncertainty was greater than normal. Not a great amount of unsteady flow Fluctuating around 1 ohm. Great amount of resistance. wobble when measuring resistance and voltage. Ohms law states- that electric potential over the amount of resistance is equivalent to electric current 𝑉𝑜𝑙𝑡𝑎𝑔𝑒 𝑟𝑒𝑠𝑖𝑠𝑡𝑎𝑛𝑐𝑒 = 𝐶𝑢𝑟𝑟𝑒𝑛𝑡 To evaluate for power, voltage and current must be considered Voltage and resistance were measured by the multimeter 𝐶𝑢𝑟𝑟𝑒𝑛𝑡⦁𝑉𝑜𝑙𝑡𝑎𝑔𝑒 = 𝑃𝑜𝑤𝑒𝑟 Because the amount of flow through the potential will evidently result in power Figure 3- the Voltage, Resistance, and power Calculated for Trial 1 through Trial 5, respectively (with examples of Calculations) Design #1 Voltage (In Volts) 1.3±.8 1.28±.1 1.31±.15 1.24±.05 1.4±.05 Resistance (in Ω) 7.4±.4 7.4±.4 7.1±.5 7.5±.5 7.8±.3 Power (in Watts) 0.23±.15 0.22±.03 0.24±.04 0.21±.02 0.25±.02 Example of Calculations Resistance (in Ω) 15±1 15.8±1 16±.8 16.2±.5 16.4±.5 Power (in Watts) 0.49±.07 0.55±.05 0.36±.03 0.50±.02 0.51±.04 Example of Calculations 1.3𝑉 = .18𝐴 7.4Ω . 18𝐴⦁1.3𝑉 = 0.23𝑊 Design #2 Voltage (In Volts) 2.7±.2 2.95±.1 2.4±.1 2.86±.05 2.89±.15 2.7𝑉 = .18𝐴 15Ω . 18𝐴⦁2.7𝑉 = 0.49𝑊 Design #3 Voltage (In Volts) 1.47±.1 1.4±.1 1.46±.1 1.37±.1 1.43±.1 Resistance (in Ω) 1.5±.1 1.4±.1 1.5±.1 1.4±.1 1.4±.1 Power (in Watts) 1.44±.19 1.40±.20 1.42±.14 1.34±.19 1.46±.21 Example of Calculations: 1.47𝑉 = .98𝐴 1.5Ω . 98𝐴⦁1.47𝑉 = 1.44𝑊 Example of Uncertainty Calculation: .1 .1 (1.47 + 1.5) (1.44) = ±.19 Figure 3- Power Generated in Watts Average generated power of each blade 2 1.412 1.5 1 0.5 0.482 0.23 0 Design 1 Power Design 2 Power Design 3 Power Note: the percent error could not be calculated. To calculate expected power produced, velocity of the fan could not be measured. More so, efficiency variable could not be predicted either. These go into account predicting the power of the blades. Conclusion: Because of the great amount of power generated by design #3, despite uncertainties, it is valid to accept that it did generate the most power. Design 2 generated the second most power while Design 1 generated the least power. Our hypothesis was that the more circular the blade was, the greater the power generated, because circular blades allow for greater perpendicular force due to greater air pressure. Design 1 was the least circular and produced the least amount of power, as predicted. Design 3 was the most circular design, and it produced the greatest amount of energy. This shows that there was a general trend: as the circularity of the blades increased, so did the power generated, just as predicted. Thus our hypothesis is valid. Also, the information from the source was also supported. This information said that the more circular blade will create more perpendicular force and less drag, while the rectangular blade creates more drag while spinning (Gurit). Some errors in experimentation include not measuring the velocity of the wind. Because we did not measure the velocity of the wind, we could not evaluate the percent error in the data to determine its validity. To improve upon this, we can use an anemometer to measure wind speed of the fan. Other failed methods include not measuring the area of the blades or calculating the circularity. If many different sets of wind blade sets were increased in circularity gradually, then a relationship of circularity on wind blades will be determined. To further investigate into wind blade efficiency, the optimal angle of the blade will be tested. Because we were unable to find sources regarding optimal blade angle for a wind mill, the tests may have had a different outcome (the perpendicular air pressure to drag ratio can be varied with different blade angles). Once we find optimal power generating blade angles, this experiment can be repeated with a different control of the optimal blade angle of each blade. Works Cited “Optimizing Windmill Blade Efficiency”. UC Riverside. Gurit.“Wind Turbine Blade Aerodynamics”. retrieved from: http://www.gurit.com/files/documents/2_aerodynamics.pdf


