Document
advertisement
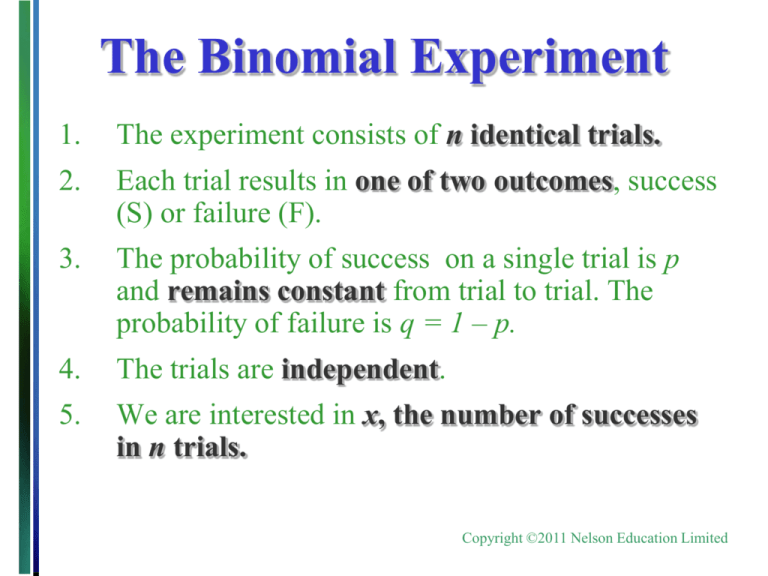
The Binomial Experiment 1. The experiment consists of n identical trials. 2. Each trial results in one of two outcomes, success (S) or failure (F). 3. The probability of success on a single trial is p and remains constant from trial to trial. The probability of failure is q = 1 – p. 4. The trials are independent. 5. We are interested in x, the number of successes in n trials. Copyright ©2011 Nelson Education Limited The Binomial Random Variable • The coin-tossing experiment is a simple example of a binomial random variable. Toss a fair coin n = 3 times and record x = number of heads. x 0 1 2 p(x) 1/8 3/8 3/8 3 1/8 Copyright ©2011 Nelson Education Limited Binomial or Not? • You play the lottery every week for 10 weeks. Let X denote the number of times you win the lottery. • Select five people from a class of size 21 and suppose that 70% of the class has the gene for tasting phenylthiocarbomide (PTC). Let X denote the number who taste PTC. • Select five people from the Canada population, and suppose that 70% of the population has the gene for tasting PTC. Let X denote the number who taste PTC. Copyright ©2011 Nelson Education Limited Example A marksman hits a target 80% of the time. He fires five shots at the target. •What is the probability that exactly 3 shots hit the target? •What is the probability that more than 3 shots hit the target? •On average, of the five shots, how many does he expect to hit? •Would it be unusual to find that none of the shots hit the target? Copyright ©2011 Nelson Education Limited Cumulative Probability Tables You can use the cumulative probability tables to find probabilities for selected binomial distributions. Find the table for the correct value of n. Find the column for the correct value of p. The row marked “k” gives the cumulative probability, P(X k) = P(X = 0) +…+ P(X = k) Copyright ©2011 Nelson Education Limited Example What is the probability that more than 3 shots hit the target? Copyright ©2011 Nelson Education Limited The Poisson Random Variable • The Poisson random variable X is a model for data that represent the number of occurrences of a specified event in a given unit of time or space. • Examples: • The number of calls received by a switchboard during a given period of time. • The number of machine breakdowns in a day • The number of traffic accidents at a given intersection during a given time period. Copyright ©2011 Nelson Education Limited The Poisson Probability Distribution • X is the number of events that occur in a period of time or space during which an average of m such events can be expected to occur. The probability of k occurrences of this event is P(X k) m ke m k! For values of k = 0, 1, 2, … The mean and standard deviation of the Poisson random variable are Mean: m Standard deviation: m Copyright ©2011 Nelson Education Limited Example The average number of traffic accidents on a certain section of highway is two per week. Find the probability of exactly one accident during a one-week period. P(X 1) k m me 1 2 2e k! 1! 2e 2 .2707 Copyright ©2011 Nelson Education Limited Cumulative Probability Tables You can use the cumulative probability tables to find probabilities for selected Poisson distributions. Find the column for the correct value of m. The row marked “k” gives the cumulative probability, P(X k) = P(X = 0) +…+ P(X = k) Copyright ©2011 Nelson Education Limited Example The average number of traffic accidents on a certain section of highway is two per week. What is the probability that there is exactly 1 accident? What is the probability that 8 or more accidents happen? Copyright ©2011 Nelson Education Limited • The increased number of small commuter planes in major airports has heightened concern over air safety. An eastern airport has recorded a monthly average of five near-misses on landings and takeoffs in the past five years. Find the probability that during a given month there are no near-misses on landings and take-offs at the airport. • Of all the Harry Potter books purchased, about 60% were purchased for readers 14 or older. If 12 Harry Potter fans are surveyed, find the probability that at least five of them are 14 or older. Copyright ©2011 Nelson Education Limited
