Ecology Graphs Practice
advertisement
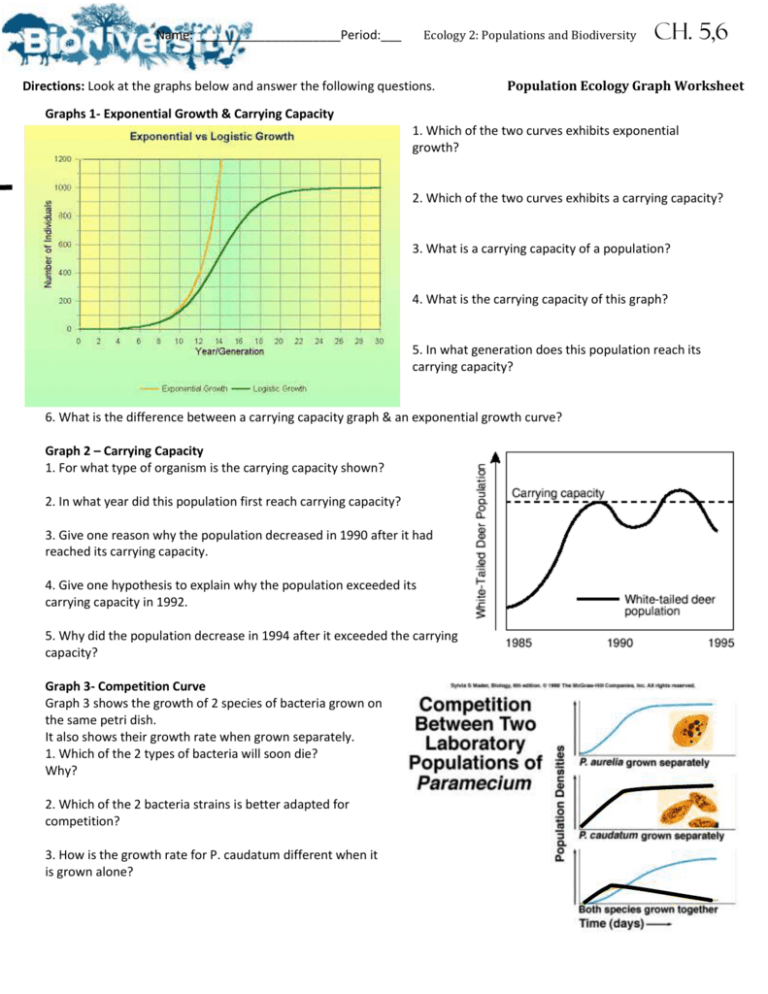
Ecology 2: Populations and Biodiversity Name: _____________________Period:___ Directions: Look at the graphs below and answer the following questions. CH. 5,6 Population Ecology Graph Worksheet Graphs 1- Exponential Growth & Carrying Capacity 1. Which of the two curves exhibits exponential growth? 2. Which of the two curves exhibits a carrying capacity? 3. What is a carrying capacity of a population? 4. What is the carrying capacity of this graph? 5. In what generation does this population reach its carrying capacity? 6. What is the difference between a carrying capacity graph & an exponential growth curve? Graph 2 – Carrying Capacity 1. For what type of organism is the carrying capacity shown? 2. In what year did this population first reach carrying capacity? 3. Give one reason why the population decreased in 1990 after it had reached its carrying capacity. 4. Give one hypothesis to explain why the population exceeded its carrying capacity in 1992. 5. Why did the population decrease in 1994 after it exceeded the carrying capacity? Graph 3- Competition Curve Graph 3 shows the growth of 2 species of bacteria grown on the same petri dish. It also shows their growth rate when grown separately. 1. Which of the 2 types of bacteria will soon die? Why? 2. Which of the 2 bacteria strains is better adapted for competition? 3. How is the growth rate for P. caudatum different when it is grown alone? Name: _____________________Period:___ Ecology 2: Populations and Biodiversity CH. 5,6 Graph 4 1. What type of graph is shown to the left? 2. Which year had the highest number of hares? 3. Which year had an equal number of hare & lynx? 4. How many lynx were present in 1910? 5. What is the relationship between the hare & lynx growth? 6. What would occur if there were more predators then prey? 7. Are predator-prey relationships density-dependent or density-independent limiting factors? Graph 5- Boom and Bust The graph below shows a population of voles (small woodland mammals). 1. Predict if the vole population increase or decrease in the year 2000? How do you know? How is this helpful to population ecologists who study the growth rate of voles? 2. What could have caused the vole population to decrease in 1989? 3. Approximately, how many years does it take for the vole population to go through one cycle (an increase & decrease)? Graph 6 - Human Population Growth Chart 1. It took 1649 years for the world population to double, going from .25 billion people to .50 billion people. How long did it take for the population to double once again? 2. How long did it take for the population to double a second time? ___________ A third time? ______ 3. Based on your graph, in what year will the population reach 8 billion? _____________ 4. Based on your graph, how many years will it take for the population of 2004 to double? _____________ 5. What factors contributed to the world's overall population growth in the last 150 years. Graph 7: Mexico and US Age Structure 1. In Mexico, what percentage of the population is between 0-4 years of age? _______ ____In the US? _____________ 2. Which population is growing the fastest?_____________________ 3. Which age group has the smallest number in both countries? ____________
