Worksheet: Interpreting Growth
advertisement
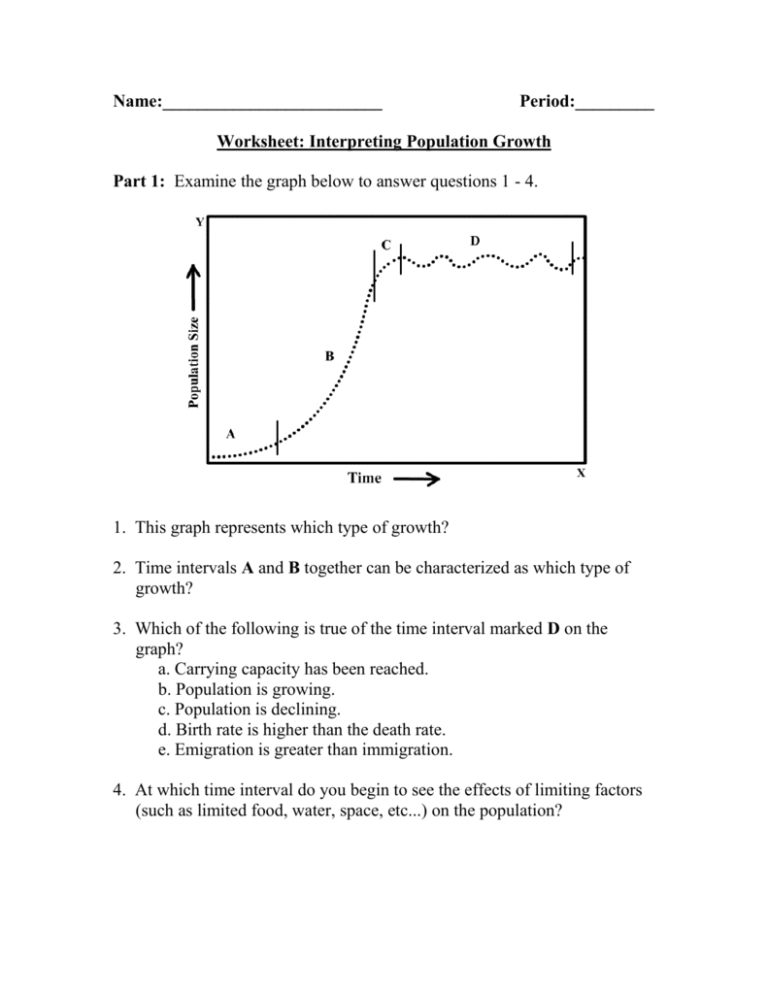
Name:_________________________ Period:_________ Worksheet: Interpreting Population Growth Part 1: Examine the graph below to answer questions 1 - 4. 1. This graph represents which type of growth? 2. Time intervals A and B together can be characterized as which type of growth? 3. Which of the following is true of the time interval marked D on the graph? a. Carrying capacity has been reached. b. Population is growing. c. Population is declining. d. Birth rate is higher than the death rate. e. Emigration is greater than immigration. 4. At which time interval do you begin to see the effects of limiting factors (such as limited food, water, space, etc...) on the population? Part 2: Examine the graph below to answer the following questions. Population: explain what is happening to the population growth at each point in the diagram using the terms: increasing, decreasing, stable Point A ________________ Point B ________________ Point C ________________ Birth Rate: explain what is happening to the birth rate at each point in the diagram using the terms: increasing, decreasing, stable Point A ________________ Point B ________________ Point C ________________ Death Rate: explain what is happening to the death rate at each point in the diagram using the terms: increasing, decreasing, stable Point A ________________ Point B ________________ Point C ________________ Relationships: Use the symbols below to describe the relationships in the following situations. Relationship greater than less than equal to Symbol > < = 1. At point A, birth rate is ______ death rate. 2. At point C, emigration is ______ immigration. 3. At point B, death rate is ______ birth rate. 4. At point A, immigration is _______ emigration. 5. The population at point A is ______ the population at point B. 6. The population at point C is ______ the population at point A.
