1.1 An Overview of Statistics
advertisement
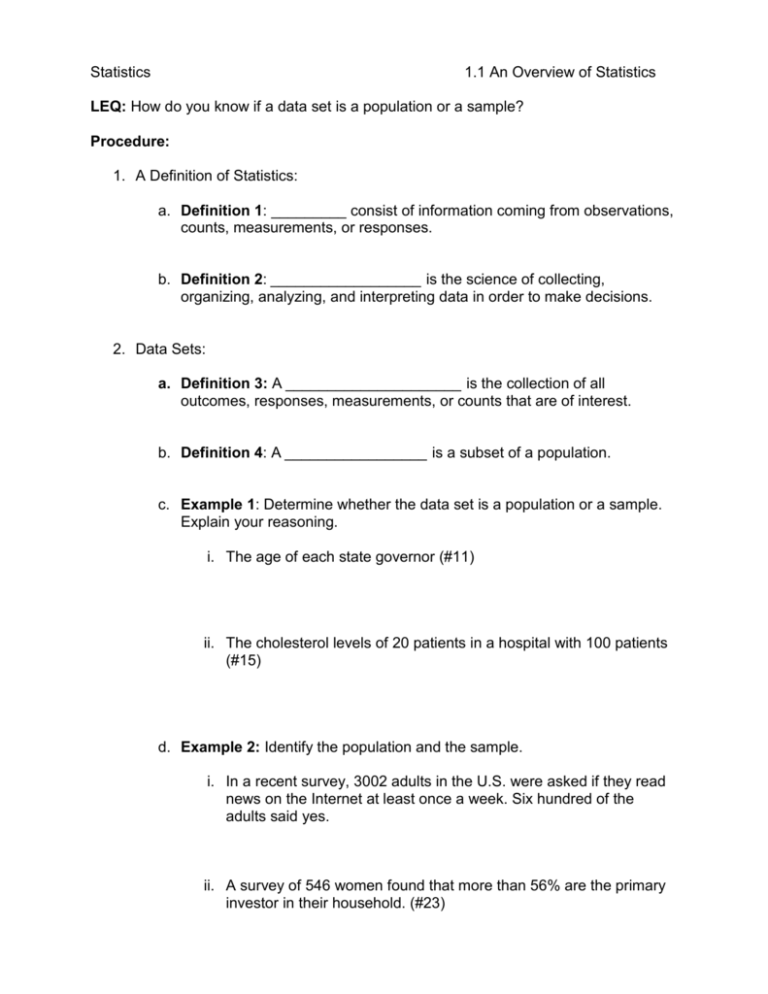
Statistics 1.1 An Overview of Statistics LEQ: How do you know if a data set is a population or a sample? Procedure: 1. A Definition of Statistics: a. Definition 1: _________ consist of information coming from observations, counts, measurements, or responses. b. Definition 2: __________________ is the science of collecting, organizing, analyzing, and interpreting data in order to make decisions. 2. Data Sets: a. Definition 3: A _____________________ is the collection of all outcomes, responses, measurements, or counts that are of interest. b. Definition 4: A _________________ is a subset of a population. c. Example 1: Determine whether the data set is a population or a sample. Explain your reasoning. i. The age of each state governor (#11) ii. The cholesterol levels of 20 patients in a hospital with 100 patients (#15) d. Example 2: Identify the population and the sample. i. In a recent survey, 3002 adults in the U.S. were asked if they read news on the Internet at least once a week. Six hundred of the adults said yes. ii. A survey of 546 women found that more than 56% are the primary investor in their household. (#23) e. Definition 5: A ____________________ is a numerical description of a population characteristic. f. Definition 6: A __________________ is a numerical description of a sample characteristic. g. Example 3: Determine whether the numerical value is a parameter or a statistic. Explain your reasoning. i. A recent survey of a sample of MBAs reported that the average starting salary for an MBA is less than $65,000. ii. Starting salaries for the 667 MBA graduates from the University of Chicago Graduate School of Business increased 8.5% from the previous year. iii. The average annual salary for 35 of a company’s 1200 accountants is $68,000. (#25) iv. In a recent year, the interest category for 12% of all new magazines was sports. (#28) 3. Branches of Statistics: a. Definition 7: _____________________________ is a branch of statistics that involves the organization, summarization, and the display of data. b. Definition 8: _____________________________is the branch of statistics that involves using a sample to draw conclusions about a population. A basic tool in the study of inferential statistics is probability. c. Example 4: Decide which part of the study represents the descriptive branch of statistics. What conclusions might be drawn from the study using inferential statistics? i. A large sample of men, aged 48, was studied for 18 years. For unmarried men, approximately 70% were alive at age 65. For married men, 90% were alive at age 65. ii. In a sample of Wall Street analysts, the percentage who incorrectly forecasted high-tech earnings in a recent year was 44%. d. Example 5: Solve the following problem. i. In a recent study, volunteers who had 8 hours of sleep were three times more likely to answer correctly on a math test than were sleep-deprived participants. (#34) 1. Identify the sample used in the study. 2. What is the sample’s population? 3. Which part of the study represents the descriptive branch of statistics? 4. Make an inference based on the results of the study. 4. HW: p. 6 (1 – 10 all, 12 – 36 mo3)
