Lab Report Format
advertisement
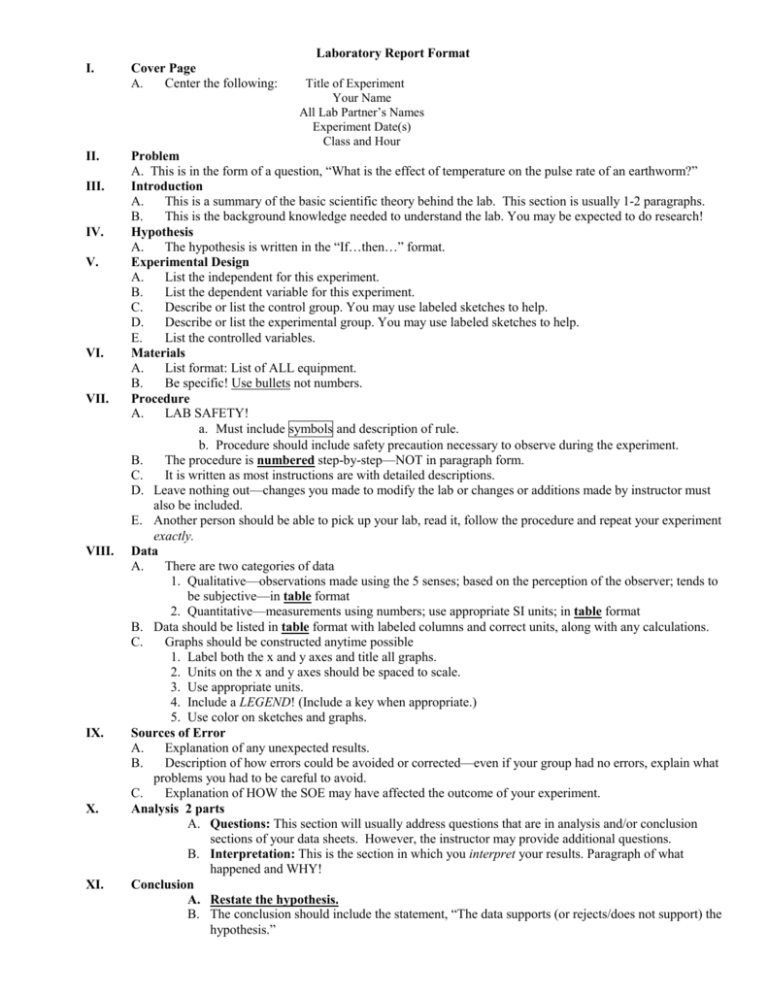
Laboratory Report Format I. II. III. IV. V. VI. VII. VIII. IX. X. XI. Cover Page A. Center the following: Title of Experiment Your Name All Lab Partner’s Names Experiment Date(s) Class and Hour Problem A. This is in the form of a question, “What is the effect of temperature on the pulse rate of an earthworm?” Introduction A. This is a summary of the basic scientific theory behind the lab. This section is usually 1-2 paragraphs. B. This is the background knowledge needed to understand the lab. You may be expected to do research! Hypothesis A. The hypothesis is written in the “If…then…” format. Experimental Design A. List the independent for this experiment. B. List the dependent variable for this experiment. C. Describe or list the control group. You may use labeled sketches to help. D. Describe or list the experimental group. You may use labeled sketches to help. E. List the controlled variables. Materials A. List format: List of ALL equipment. B. Be specific! Use bullets not numbers. Procedure A. LAB SAFETY! a. Must include symbols and description of rule. b. Procedure should include safety precaution necessary to observe during the experiment. B. The procedure is numbered step-by-step—NOT in paragraph form. C. It is written as most instructions are with detailed descriptions. D. Leave nothing out—changes you made to modify the lab or changes or additions made by instructor must also be included. E. Another person should be able to pick up your lab, read it, follow the procedure and repeat your experiment exactly. Data A. There are two categories of data 1. Qualitative—observations made using the 5 senses; based on the perception of the observer; tends to be subjective—in table format 2. Quantitative—measurements using numbers; use appropriate SI units; in table format B. Data should be listed in table format with labeled columns and correct units, along with any calculations. C. Graphs should be constructed anytime possible 1. Label both the x and y axes and title all graphs. 2. Units on the x and y axes should be spaced to scale. 3. Use appropriate units. 4. Include a LEGEND! (Include a key when appropriate.) 5. Use color on sketches and graphs. Sources of Error A. Explanation of any unexpected results. B. Description of how errors could be avoided or corrected—even if your group had no errors, explain what problems you had to be careful to avoid. C. Explanation of HOW the SOE may have affected the outcome of your experiment. Analysis 2 parts A. Questions: This section will usually address questions that are in analysis and/or conclusion sections of your data sheets. However, the instructor may provide additional questions. B. Interpretation: This is the section in which you interpret your results. Paragraph of what happened and WHY! Conclusion A. Restate the hypothesis. B. The conclusion should include the statement, “The data supports (or rejects/does not support) the hypothesis.”
