Answers
advertisement

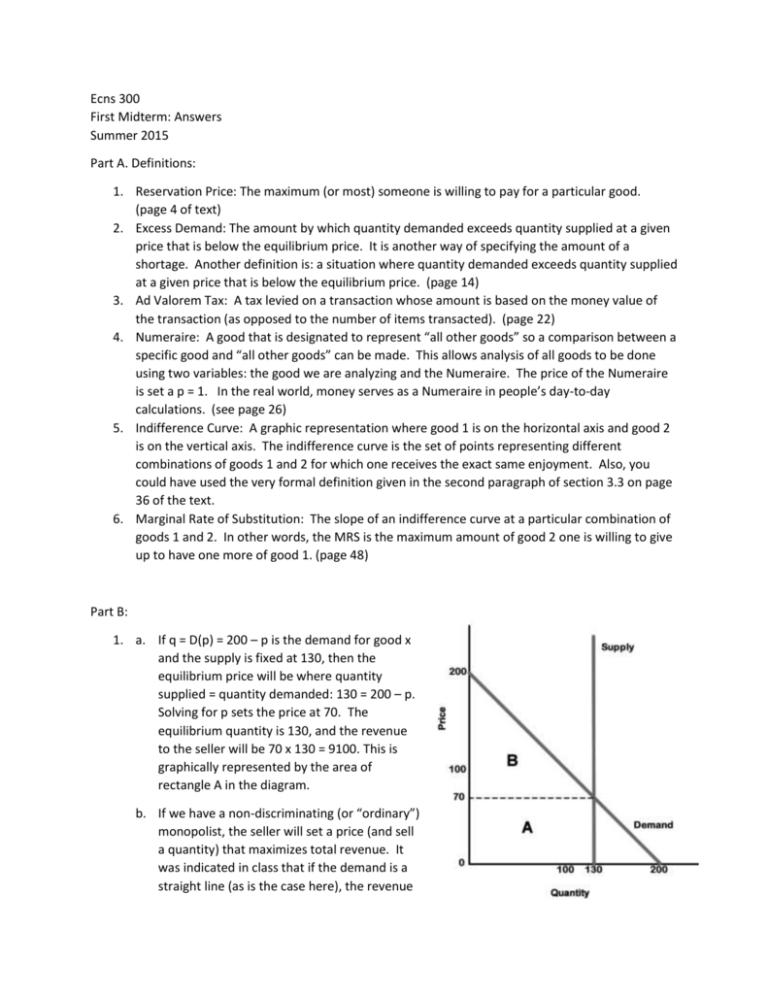
Ecns 300 First Midterm: Answers Summer 2015 Part A. Definitions: 1. Reservation Price: The maximum (or most) someone is willing to pay for a particular good. (page 4 of text) 2. Excess Demand: The amount by which quantity demanded exceeds quantity supplied at a given price that is below the equilibrium price. It is another way of specifying the amount of a shortage. Another definition is: a situation where quantity demanded exceeds quantity supplied at a given price that is below the equilibrium price. (page 14) 3. Ad Valorem Tax: A tax levied on a transaction whose amount is based on the money value of the transaction (as opposed to the number of items transacted). (page 22) 4. Numeraire: A good that is designated to represent “all other goods” so a comparison between a specific good and “all other goods” can be made. This allows analysis of all goods to be done using two variables: the good we are analyzing and the Numeraire. The price of the Numeraire is set a p = 1. In the real world, money serves as a Numeraire in people’s day-to-day calculations. (see page 26) 5. Indifference Curve: A graphic representation where good 1 is on the horizontal axis and good 2 is on the vertical axis. The indifference curve is the set of points representing different combinations of goods 1 and 2 for which one receives the exact same enjoyment. Also, you could have used the very formal definition given in the second paragraph of section 3.3 on page 36 of the text. 6. Marginal Rate of Substitution: The slope of an indifference curve at a particular combination of goods 1 and 2. In other words, the MRS is the maximum amount of good 2 one is willing to give up to have one more of good 1. (page 48) Part B: 1. a. If q = D(p) = 200 – p is the demand for good x and the supply is fixed at 130, then the equilibrium price will be where quantity supplied = quantity demanded: 130 = 200 – p. Solving for p sets the price at 70. The equilibrium quantity is 130, and the revenue to the seller will be 70 x 130 = 9100. This is graphically represented by the area of rectangle A in the diagram. b. If we have a non-discriminating (or “ordinary”) monopolist, the seller will set a price (and sell a quantity) that maximizes total revenue. It was indicated in class that if the demand is a straight line (as is the case here), the revenue is maximized at the midpoint on the line between the vertical and horizontal axes. In this case, that occurs where q = 100 and p = 100. The revenue is 100 x 100 = 10,000. c. A discriminating monopolist charges the maximum each buyer is willing to pay until all units are sold. So, there is no single price that is charged (as occurs in the situations described in parts a and b of this problem), but the maximum quantity is 130 (since that is all the seller has to supply). The revenue to the seller will be the area under the demand curve up to a quantity of 130, represented by the combined areas of rectangle A and triangle B in the diagram. Area of A = 9100 (from part a of this question); the area of B = ½ x 130 x 130 = 8450. The total revenue to the discriminating monopolist is A + B = 17,550. 2. a. The budget equation is $2x1 + $1x2 = $100 b. c. d. The budget line for quantities of good 1 between 0 and 20 is not affected by the tax, so the price of good 1 is $2. But for amounts greater than 20, there is an excise tax of $1 added to the price, so the consumer must pay $3 per unit. This makes the slope of the budget line change from -2 for quantities between 0 and 20 to a slope of -3 for quantities greater than 20. 3. a. The indifference curves are straight lines with a slope = -5 b. The indifference curves are “L” shaped with the corners lying on a line that signifies the 3 to 1 ratio that goods 1 and 2 are used in complementary consumption. c. Preference directions change when good 1 becomes a bad. Part C. 4. See page 45 of your text; bottom paragraph. 5. a. The budget line is the sold line in the diagram to the right. The slope of the first segment (for quantities of good 1 up to 10) is -4, reflecting that p1 = $4; the slope of the second (middle) segment is -2; and the slope of the third segment is -1. b. The dashed line in the diagram is the budget line if there is a single price of good 1: p1 = $2. That budget line has a slope of -2. c. Sam would prefer the single price of $2 per unit because all points on the dashed budget line—except for the two end points on the axes—give Sam the ability to buy more of goods 1 and 2 than he can if he is constrained to the solid budget line. d. Sellers would generally prefer the solid budget line for a simple reason: they can make more money. For example, selling the first 10 units for $4 brings in twice as much as selling for $2. Suppose the seller wants to sell 30 of good 1. Under the “quantity discount” scheme, he will make $40 on the first 10, and additional $40 on the next 20 for a grand total of $80. On the other hand, by selling 30 at $2 apiece, he makes $60. (Note that if 50 units are sold, the two pricing schemes yield the same revenue to the seller of $100.)


