Keystone 7.2
advertisement
Keystone Workshop
Unit 7 Day 2-3: Predictions from Data and Representations of Data
Warm-up
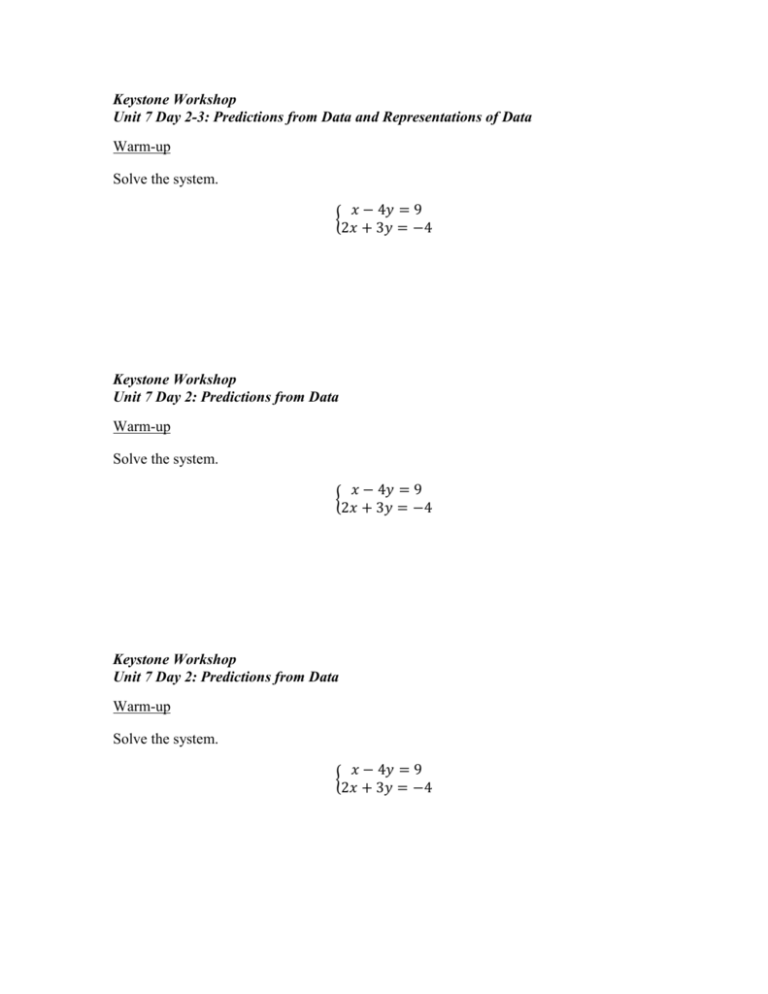
Solve the system.
𝑥 − 4𝑦 = 9
{
2𝑥 + 3𝑦 = −4
Keystone Workshop
Unit 7 Day 2: Predictions from Data
Warm-up
Solve the system.
𝑥 − 4𝑦 = 9
{
2𝑥 + 3𝑦 = −4
Keystone Workshop
Unit 7 Day 2: Predictions from Data
Warm-up
Solve the system.
𝑥 − 4𝑦 = 9
{
2𝑥 + 3𝑦 = −4
Keystone Workshop
Unit 7 Day 2: Predictions from Data and Representations of Data
Goal: Estimate or calculate to make predictions based on circle, line, or bar graph,
measures of central tendency, or other representations
I. Predictions Based on Trends
___________________________________________ found from data are often used
to predict outcomes of larger populations or future events.
Example 1:
II. Predictions Based on Probability
Predictions can be made on populations of data by finding probabilities of events
occurring in samples.
Ex. The graph below shows the responses of 50 people to a survey question. If the same
survey is conducted using 600 responses, predict how many people would be undecided.
Example 2:
III. Box-and-Whisker Plots
The ___________________________ is the left-most whisker
The _____________________________is the left edge of the box
The ________________________________________ is the middle of the box
The _____________________________ is the right edge of the box
The ____________________________ is the right-most whisker
Example 3:
Example 4:
IV. Stem-and-Leaf Plots
Left digit of all data values are lined up in the __________ of the plot
The right digit of each data value is placed in the corresponding ___________
o Ex. The ages of cast members in a play are 19, 35, 16, 24, 22, 37, 60, 34, 57,
and 19. Make a stem and leaf plot.
Example 5:
HW: Pages 181-183 AND 188-190
