Interpreting Graphs Homework Answer Key
advertisement

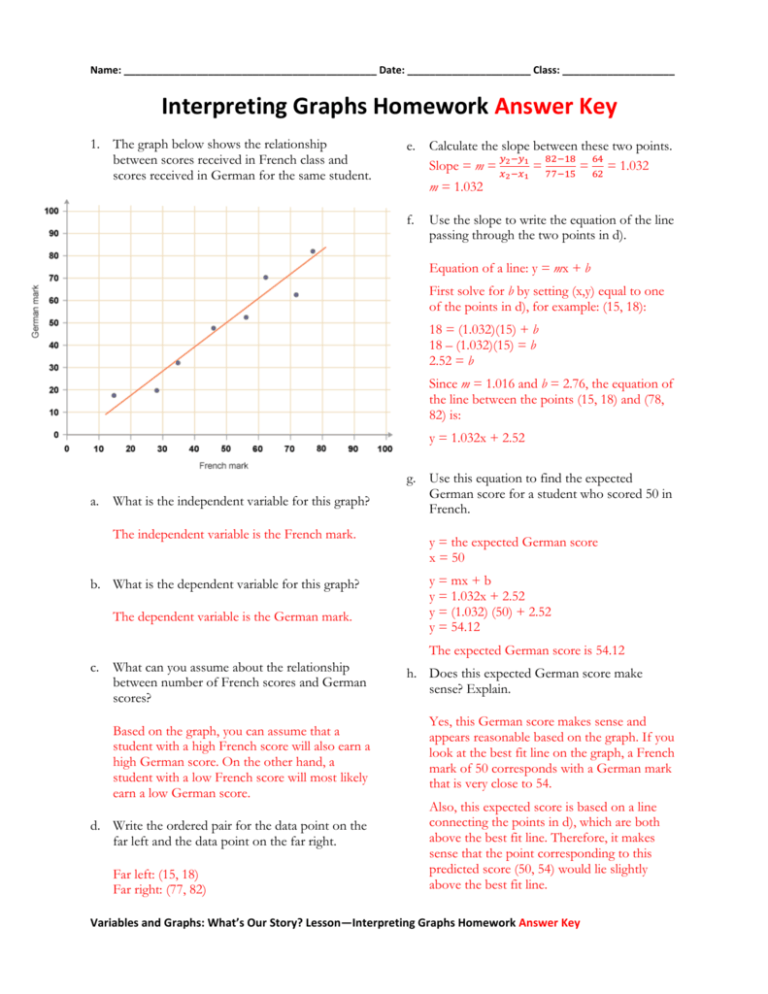
Name: _____________________________________________ Date: ______________________ Class: ____________________ Interpreting Graphs Homework Answer Key 1. The graph below shows the relationship between scores received in French class and scores received in German for the same student. e. Calculate the slope between these two points. 𝑦 −𝑦 82−18 64 Slope = m = 𝑥2 −𝑥1 = 77−15 = 62 = 1.032 m = 1.032 f. 2 1 Use the slope to write the equation of the line passing through the two points in d). Equation of a line: y = mx + b First solve for b by setting (x,y) equal to one of the points in d), for example: (15, 18): 18 = (1.032)(15) + b 18 – (1.032)(15) = b 2.52 = b Since m = 1.016 and b = 2.76, the equation of the line between the points (15, 18) and (78, 82) is: y = 1.032x + 2.52 a. What is the independent variable for this graph? The independent variable is the French mark. b. What is the dependent variable for this graph? The dependent variable is the German mark. g. Use this equation to find the expected German score for a student who scored 50 in French. y = the expected German score x = 50 y = mx + b y = 1.032x + 2.52 y = (1.032) (50) + 2.52 y = 54.12 The expected German score is 54.12 c. What can you assume about the relationship between number of French scores and German scores? Based on the graph, you can assume that a student with a high French score will also earn a high German score. On the other hand, a student with a low French score will most likely earn a low German score. d. Write the ordered pair for the data point on the far left and the data point on the far right. Far left: (15, 18) Far right: (77, 82) h. Does this expected German score make sense? Explain. Yes, this German score makes sense and appears reasonable based on the graph. If you look at the best fit line on the graph, a French mark of 50 corresponds with a German mark that is very close to 54. Also, this expected score is based on a line connecting the points in d), which are both above the best fit line. Therefore, it makes sense that the point corresponding to this predicted score (50, 54) would lie slightly above the best fit line. Variables and Graphs: What’s Our Story? Lesson—Interpreting Graphs Homework Answer Key


