File - Chemistry Honors
advertisement
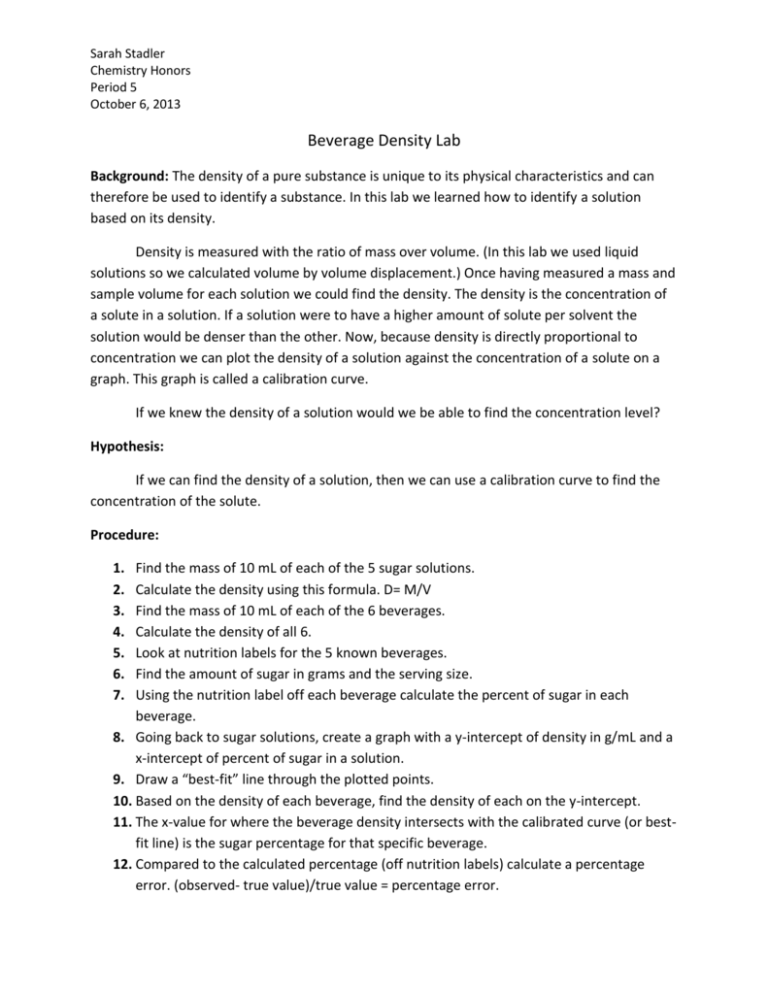
Sarah Stadler Chemistry Honors Period 5 October 6, 2013 Beverage Density Lab Background: The density of a pure substance is unique to its physical characteristics and can therefore be used to identify a substance. In this lab we learned how to identify a solution based on its density. Density is measured with the ratio of mass over volume. (In this lab we used liquid solutions so we calculated volume by volume displacement.) Once having measured a mass and sample volume for each solution we could find the density. The density is the concentration of a solute in a solution. If a solution were to have a higher amount of solute per solvent the solution would be denser than the other. Now, because density is directly proportional to concentration we can plot the density of a solution against the concentration of a solute on a graph. This graph is called a calibration curve. If we knew the density of a solution would we be able to find the concentration level? Hypothesis: If we can find the density of a solution, then we can use a calibration curve to find the concentration of the solute. Procedure: 1. 2. 3. 4. 5. 6. 7. Find the mass of 10 mL of each of the 5 sugar solutions. Calculate the density using this formula. D= M/V Find the mass of 10 mL of each of the 6 beverages. Calculate the density of all 6. Look at nutrition labels for the 5 known beverages. Find the amount of sugar in grams and the serving size. Using the nutrition label off each beverage calculate the percent of sugar in each beverage. 8. Going back to sugar solutions, create a graph with a y-intercept of density in g/mL and a x-intercept of percent of sugar in a solution. 9. Draw a “best-fit” line through the plotted points. 10. Based on the density of each beverage, find the density of each on the y-intercept. 11. The x-value for where the beverage density intersects with the calibrated curve (or bestfit line) is the sugar percentage for that specific beverage. 12. Compared to the calculated percentage (off nutrition labels) calculate a percentage error. (observed- true value)/true value = percentage error. Sarah Stadler Chemistry Honors Period 5 October 6, 2013 Results: Data Table A: Density of Reference Solutions Solution Sample Volume, mL Mass, g Density, g/mL 0% Sugar 90634 g 10.00 .964 g/mL 5% Sugar 9.95 g 10.00 .995 g/mL 10% Sugar 10.13 g 10.00 1.013 g/mL 15% Sugar 10.35 g 10.00 1.035 g/mL 20% Sugar 10.58 g 10.00 1.058 g/mL Data Table B: Beverage Density Beverage Sample Volume, mL Mass, g Density, g/mL Powerade 10.04 g 10.00 1.004 g/mL Diet Pepsi 9.78 g 10.00 0.978 g/mL Apple Juice 10.16 g 10.00 1.016 g/mL Pepsi 10.19 g 10.00 1.019 g/mL Lemonade 10.32 g 10.00 1.032 g/mL Unknown 10.22 g 10.00 1.022 g/mL Post-Lab: Results Table Beverage Measure d density, g/mL Percent sugar (experimental ) Amount of sugar (Nutrition label) Percent sugar (calculated from Percent error Sarah Stadler Chemistry Honors Period 5 October 6, 2013 Nutrition label) Powerade 1.004 g/mL 8.5% 21 g/ 360 mL 5.817% 46.12% pepsi 0.978 g/mL 3% 0 g/ 355 mL 0% 3% Apple Juice 1.016 g/mL 11% 27 g/ 240 mL 11.07% 0.6323% Diet pepsi 1.019 g/mL 12% 41 g/ 355 mL 11.34% 5.82% Lemonade 1.032 g/mL 14% 31 g/ 240 mL 12.52% 11.82% Results Table: Beverage Experimental % sugar 8.5% Powerade 3% Diet Pepsi Apple Juice 11% 12% Pepsi 14% Lemonade Analysis: Sarah Stadler Chemistry Honors Period 5 October 6, 2013 We learned prior to the lab that density of solutions is based on mass to volume, but can also change with volume. Now, water is confusing for two reasons: water (0% sugar solution) 1 mL of water has a mass of 1 gram, leaving the density of water at 1 g/ mL, and that the volume of water changes in two different ways. With pure water the volume will decrease from 0 degrees Celsius to 4 degrees Celsius, but then increase from 4 degrees and above. So actually, water has a density of 1 g/ mL only at certain temperature. When drawing a line through your plotted points it is not appropriate to connect-thedots because they are off the line for the error and that other things might be affecting the density. This lab is not precise with beverages because there are other things in the solution that affect the density. Conclusion: After carefully constructing a calibration curve we were successful at finding the concentration of a solute based on its density.
