Negative and Positive Feedback Graphing Activity Background
advertisement
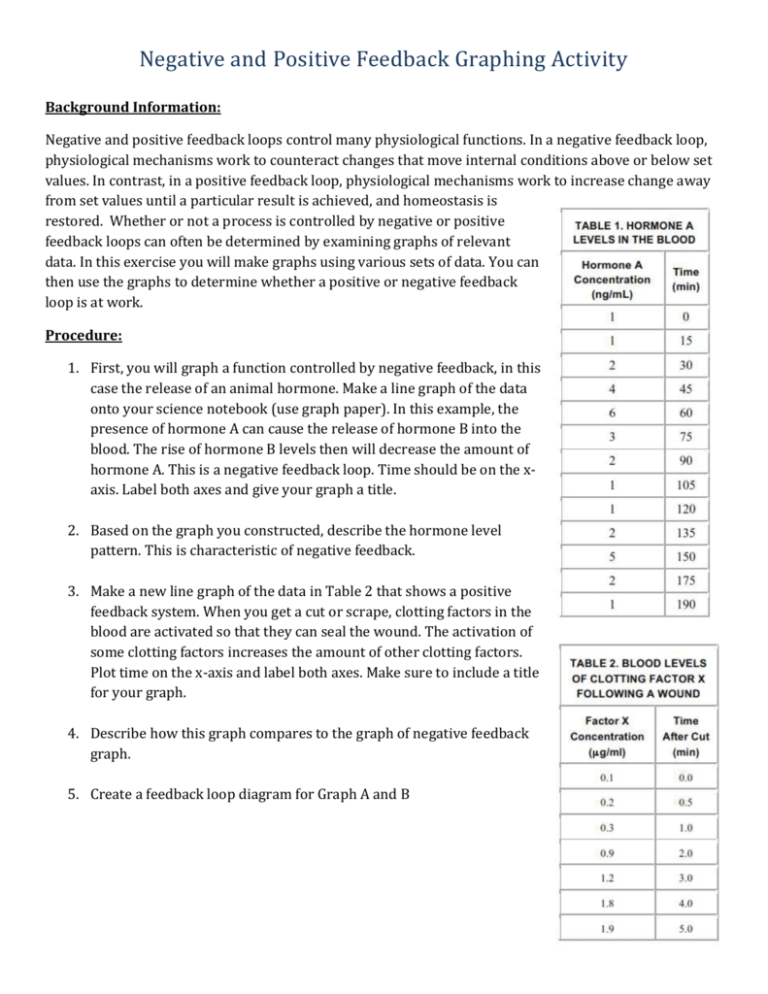
Negative and Positive Feedback Graphing Activity Background Information: Negative and positive feedback loops control many physiological functions. In a negative feedback loop, physiological mechanisms work to counteract changes that move internal conditions above or below set values. In contrast, in a positive feedback loop, physiological mechanisms work to increase change away from set values until a particular result is achieved, and homeostasis is restored. Whether or not a process is controlled by negative or positive feedback loops can often be determined by examining graphs of relevant data. In this exercise you will make graphs using various sets of data. You can then use the graphs to determine whether a positive or negative feedback loop is at work. Procedure: 1. First, you will graph a function controlled by negative feedback, in this case the release of an animal hormone. Make a line graph of the data onto your science notebook (use graph paper). In this example, the presence of hormone A can cause the release of hormone B into the blood. The rise of hormone B levels then will decrease the amount of hormone A. This is a negative feedback loop. Time should be on the xaxis. Label both axes and give your graph a title. 2. Based on the graph you constructed, describe the hormone level pattern. This is characteristic of negative feedback. 3. Make a new line graph of the data in Table 2 that shows a positive feedback system. When you get a cut or scrape, clotting factors in the blood are activated so that they can seal the wound. The activation of some clotting factors increases the amount of other clotting factors. Plot time on the x-axis and label both axes. Make sure to include a title for your graph. 4. Describe how this graph compares to the graph of negative feedback graph. 5. Create a feedback loop diagram for Graph A and B Negative and Positive Feedback Graphing Activity 6. Using the Tables 3 and 4 and create 2 new graphs. Determine whether the situation described is controlled by negative feedback or positive feedback loops. 7. Graph 3: After a meal, the concentration of glucose in a person’s blood will start to change from its baseline value, as shown in Table 3. Make another line graph using this data. Plot time on the x-axis. Label the axes and give your graph an appropriate title. 8. Graph 4: In females, the levels of the hormone estrogen in the blood peak just prior to ovulation, the release of an egg from the ovary. A rise in estrogen causes the release of a hormone from the brain (luteinizing hormone), which leads to the additional increases in estrogen levels. Make another line graph using the data in Table 4. Again, the x-axis should be time; label the axes and give your graph a title. 9. LABEL THE GRAPHS: Compare your graphs made using Table 3 and Table 4. Decide whether positive or negative feedback loops control those processes. Label each graph as either positive or negative feedback loop. Analysis Questions: Answer the following questions in complete sentences onto your science notebook. Do not copy down the questions; just use the questions in your answer. 1. How are the graphs of a body chemical controlled by negative feedback and a chemical controlled by positive feedback similar? How are they different? 2. It’s around lunchtime and you are feeling hungry, so you eat a sandwich. When the food passes through your stomach and into your small intestine during digestion, your brain receives a signal causing you to feel full. Consequently, you do not eat any more food. Is this is an example of negative or positive feedback? Explain and justify your answer. 3. Mitochondria, the organelles involved in cellular respiration, can also generate chemicals called reactive oxygen species (ROSs). ROSs can damage mitochondria. Damaged mitochondria in turn will generate more ROSs than healthy mitochondria. Is this is an example of negative or positive feedback? 4. Based on what you know about negative feedback loops and homeostasis, explain how the two processes are related?
