Assignment 2 Solution
advertisement

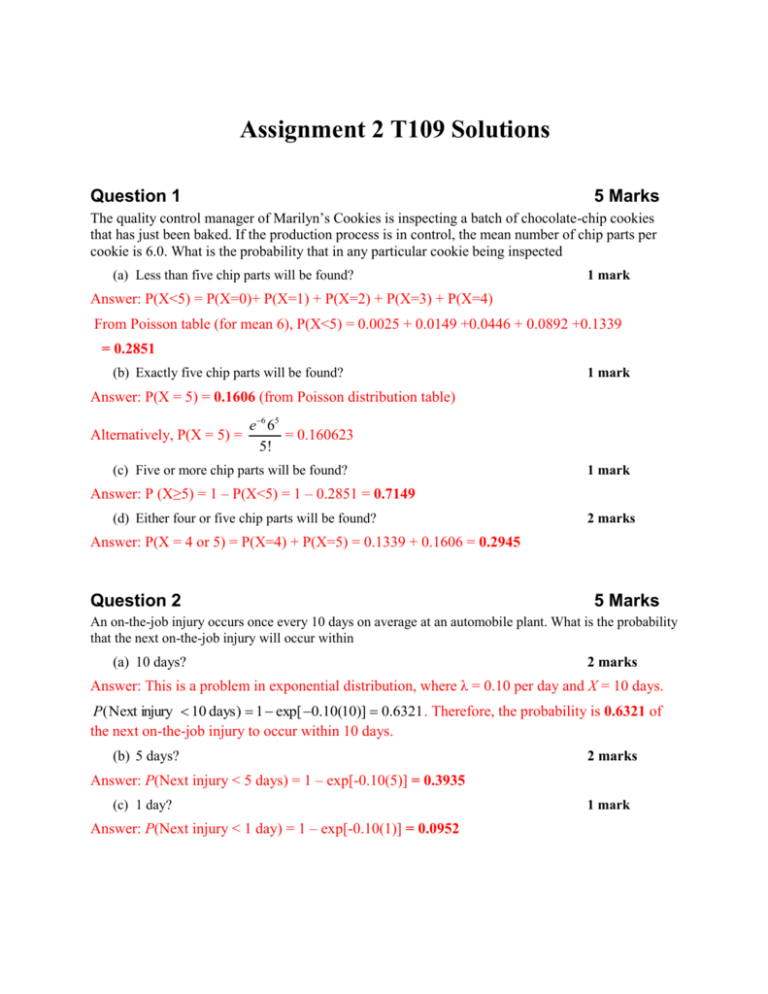
Assignment 2 T109 Solutions Question 1 5 Marks The quality control manager of Marilyn’s Cookies is inspecting a batch of chocolate-chip cookies that has just been baked. If the production process is in control, the mean number of chip parts per cookie is 6.0. What is the probability that in any particular cookie being inspected (a) Less than five chip parts will be found? 1 mark Answer: P(X<5) = P(X=0)+ P(X=1) + P(X=2) + P(X=3) + P(X=4) From Poisson table (for mean 6), P(X<5) = 0.0025 + 0.0149 +0.0446 + 0.0892 +0.1339 = 0.2851 (b) Exactly five chip parts will be found? 1 mark Answer: P(X = 5) = 0.1606 (from Poisson distribution table) Alternatively, P(X = 5) = e6 65 = 0.160623 5! (c) Five or more chip parts will be found? 1 mark Answer: P (X≥5) = 1 – P(X<5) = 1 – 0.2851 = 0.7149 (d) Either four or five chip parts will be found? 2 marks Answer: P(X = 4 or 5) = P(X=4) + P(X=5) = 0.1339 + 0.1606 = 0.2945 Question 2 5 Marks An on-the-job injury occurs once every 10 days on average at an automobile plant. What is the probability that the next on-the-job injury will occur within (a) 10 days? 2 marks Answer: This is a problem in exponential distribution, where λ = 0.10 per day and X = 10 days. P( Next injury 10 days ) 1 exp[ 0.10(10)] 0.6321 . Therefore, the probability is 0.6321 of the next on-the-job injury to occur within 10 days. (b) 5 days? 2 marks Answer: P(Next injury < 5 days) = 1 – exp[-0.10(5)] = 0.3935 (c) 1 day? Answer: P(Next injury < 1 day) = 1 – exp[-0.10(1)] = 0.0952 1 mark Question 3 5 Marks Surveys have been conducted on politicians around the world as a way of monitoring the opinions of the electorate. Six month ago, a survey was undertaken to determine the degree of support for a National Party politician. Of a sample of 1000, 56% indicated that they would vote for the politician. This month, another survey of 800 voters revealed that 46% now support the politician. (a) At the 5% significance level, can we infer that the politician’s population has decreased? 2 marks Answer: Lower confidence limit for the earlier survey is = pz p(1 p) n = 0.56(1 0.56) = 0.5292. The upper confidence limit for the later survey is = 1000 p(1 p) 0.46(1 0.46) = 0.46 1.96 = 0.4945. Since the upper limit of the later is lower pz n 800 than the lower limit of the former (the confidence intervals do not overlap) we can state that the proportion of the population who support of the politician has significantly declined at 5% significance level. (Note that there are other ways of solving this problem.) 0.56 1.96 (b) At the 5% significance level, can we infer that the politician’s population has decreased by more than 5%? 2 marks Answer: The difference between the two probabilities as estimated in part (a) is 0.5292 – 0.4945 =0.0347. The difference in proportion 3.47% is less than 5%, and therefore, we cannot infer that the politician’s support population has decreased by more than 5%. (c) Estimate the decrease in percentage support between now and six months ago. 1 mark Answer: The expected value of the decrease in percentage support is 10 percent (=0.56 – 0.46), but it is at least 3.47% at 5% level of significance. Question 4 5 Marks A market researcher for a consumer electronics company wants to study the television viewing habits of residents of a particular area. A random sample of 40 respondents is selected, and each respondent is instructed to keep a detailed record of all television viewing in a particular week. The results are as follows: Viewing time per week: X 15 .3 hours, S = 3.8 hours. 27 respondents watch the evening news on at least 3 weeknights. (a) Construct a 95% confidence interval estimate for the mean amount of television watched per week in this city. 1 Mark Answer: Confidence interval = X t n 1 also use the expression X Z S n , but since the sample size is greater than 30 we can S . The t value with 39 degrees of freedom is 2.02 and the Z n value for 95% confidence interval is 1.96. The confidence interval is (14.09, 16.51) using t value and (14.12, 16.48) using normal distribution. (b) Construct a 95% confidence interval estimate for the population proportion who watch the evening news on at least 3 weeknights per week. 1 Mark Answer: p = 27/40 = 0.675. Confidence interval = p z 0.675 1.96 p(1 p) = n 0.675(1 0.675) = (0.5298, 0.8202) 40 Suppose that the market researcher wants to take another survey in a different city. Answer these questions: (c) What sample size is required to be 95% confident of estimating the population mean to within 2 hours and assumes that the population standard deviation is equal to 5 hours? 1 Mark Z 2 2 (1.96) 2 5 2 Answer: Sample size, n = = 24.01, which should be rounded up to 25. 22 e2 (d) What sample size is needed to be 95% confident of being with in 0.035 of the population proportion who watch the evening news on at least 3 weeknights if no previous estimate is available? 1 Mark Z 2 p(1 p) (1.96) 2 0.5(1 0.5) Answer: Sample size, n = = 784, which is the maximum size (0.035) 2 e2 because no previous estimate is available and p=0.5 gives the maximum size. (e) Based on (c) and (d), what sample size should the market researcher select if a single survey is being conducted? 1 Mark Answer: To meet both the criteria the sample size of 784 should be selected in a single survey.


