Graphing Linear Equations
advertisement

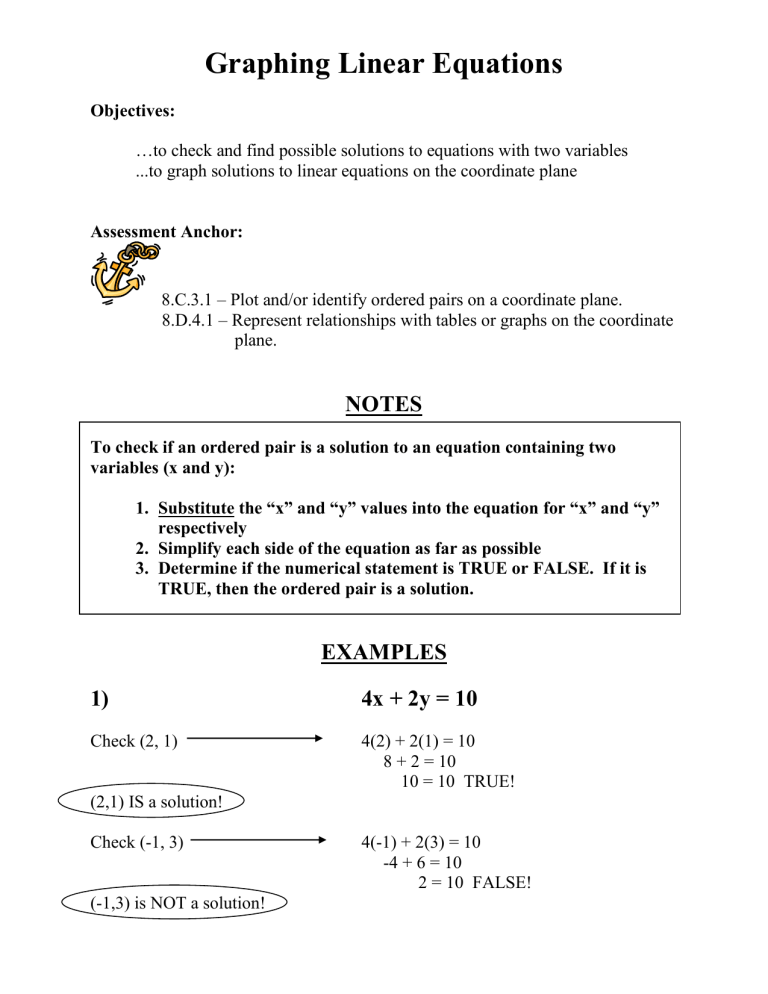
Graphing Linear Equations Objectives: …to check and find possible solutions to equations with two variables ...to graph solutions to linear equations on the coordinate plane Assessment Anchor: 8.C.3.1 – Plot and/or identify ordered pairs on a coordinate plane. 8.D.4.1 – Represent relationships with tables or graphs on the coordinate plane. NOTES To check if an ordered pair is a solution to an equation containing two variables (x and y): 1. Substitute the “x” and “y” values into the equation for “x” and “y” respectively 2. Simplify each side of the equation as far as possible 3. Determine if the numerical statement is TRUE or FALSE. If it is TRUE, then the ordered pair is a solution. EXAMPLES 1) 4x + 2y = 10 Check (2, 1) 4(2) + 2(1) = 10 8 + 2 = 10 10 = 10 TRUE! (2,1) IS a solution! Check (-1, 3) (-1,3) is NOT a solution! 4(-1) + 2(3) = 10 -4 + 6 = 10 2 = 10 FALSE! Graphing Linear Equations 4x + 2y = 10 Check (5, -5) Check (2, -1) 2) -2y = 5x – 11 Check (2, 2) -2(2) = 5(2) – 11 -4 = 10 – 11 -4 = -1 FALSE (2, 2) is NOT a solution! Check (-4, -1) (-4, -1) is NOT a solution! Check (1, 3) -2(-1) = 5(-4) – 11 2 = -20 – 11 8 = -31 FALSE Graphing Linear Equations MORE NOTES To find a solution to an equation containing two variables (x and y): 1. Choose a value for “x”. You may choose any number you wish. 2. Substitute that value into the equation for “x”, and solve for “y” 3. Write your solution as an ordered pair (x,y) EXAMPLES 3) 4x + 2y = 10 Choose a value…like x = 3 4(3) + 2y = 10 12 + 2y = 10 – 12 – 12 2y = -2 2 2 y = -1 One solution is: (3, -1) Choose a value…like x = -5 Another solution is: (-5, 15) Choose a value ... like x = ___ 4(-5) + 2y = 10 -20 + 2y = 10 + 20 + 20 2y = 30 2 2 y = 15 Graphing Linear Equations 4) 3y = 8x + 1 Choose a value…like x = 1 3y = 8(1) + 1 3y = 8 + 1 3y = 9 3 3 y=3 One solution is: (1, 3) Choose a value…like x = -2 3y = 8(-2) + 1 3y = -16 + 1 3y = -15 3 3 y = -5 Another solution is: (-2, -5) Choose a value…like x = ___ Choose a value...like x = ___ ****Remember, these solutions are just a few of the INFINITE number of solutions you could come up with for equations like 3y = 8x + 1!!! Graphing Linear Equations EVEN MORE NOTES Definition: LINEAR EQUATION - an equation whose graph is a straight line To graph linear equations (using T-tables): 1. Make a T-table that contains at least 3 ordered pairs a. You may choose whatever numbers you want for “x”, but keep it simple b. Choosing 0, 1, and 2 will be helpful MOST of the time c. Each time you substitute a value for “x”, solve for “y” so that you can fill in the table 2. Once the table is complete, GRAPH each ordered pair on a coordinate system d. The points you have should be in a straight line e. If they are not, check if you’ve graphed them correctly OR check if your table is correct 3. Draw a line by connecting those points with a ruler and putting arrows on each side ***The line that you have made shows ALL THE SOLUTIONS to the linear equation!!! Here is a basic coordinate system: y 5 4 3 2 1 -5 -4 -3 -2 -1 1 -1 -2 -3 -4 -5 2 3 4 5 x Graphing Linear Equations EXAMPLES 5) Graph this equation: y = 3x – 2 STEP 1: Make a T-table X Y 0 -2 1 1 2 4 y = 3x – 2 y = 3x – 2 y = 3x – 2 y = 3(0) – 2 y=0–2 y = -2 y = 3(1) – 2 y=3–2 y=1 y = 3(2) – 2 y=6–2 y=4 STEP 2: Graph the points y 5 4 3 2 1 -5 -4 -3 -2 -1 1 2 3 4 5 x 1 2 3 4 5 x -1 -2 -3 -4 -5 Step 3: Draw the line y 5 4 3 2 1 -5 -4 -3 -2 -1 -1 -2 -3 -4 -5 Graphing Linear Equations 6) Graph this equation: 4y = -8x + 20 Now graph: y = -2x + 5 4y = -8x + 20 4 4 y = -2x + 5 STEP 1: Make a T-table X 0 1 2 Y 5 3 1 y = -2x + 5 y = -2x + 5 y = -2x + 5 y = -2(0) + 5 y=0+5 y=5 y = -2(1) + 5 y = -2 + 5 y=3 y = -2(2) + 5 y = -4 + 5 y=1 STEP 2: Graph the points y 5 4 3 2 1 -5 -4 -3 -2 -1 1 2 3 4 5 x 1 2 3 4 5 x -1 -2 -3 -4 -5 Step 3: Draw the line y 5 4 3 2 1 -5 -4 -3 -2 -1 -1 -2 -3 -4 -5 Graphing Linear Equations 7) Graph this equation: -2y = -2x + 6 Make a T-table: Graph points and draw the line: y 5 4 3 2 1 -5 -4 -3 -2 -1 1 -1 -2 -3 -4 -5 2 3 4 5 x


