P 8-2:
advertisement
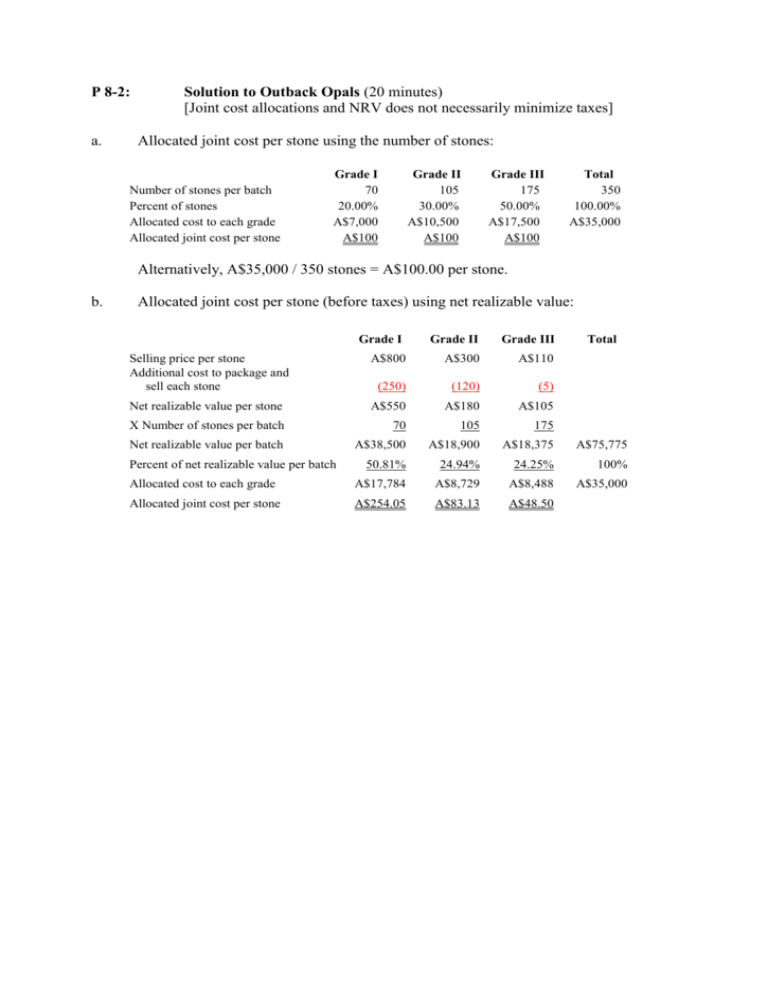
P 8-2: a. Solution to Outback Opals (20 minutes) [Joint cost allocations and NRV does not necessarily minimize taxes] Allocated joint cost per stone using the number of stones: Number of stones per batch Percent of stones Allocated cost to each grade Allocated joint cost per stone Grade I 70 20.00% A$7,000 A$100 Grade II 105 30.00% A$10,500 A$100 Grade III 175 50.00% A$17,500 A$100 Total 350 100.00% A$35,000 Alternatively, A$35,000 / 350 stones = A$100.00 per stone. b. Allocated joint cost per stone (before taxes) using net realizable value: Grade I Grade II Grade III Selling price per stone Additional cost to package and sell each stone A$800 A$300 A$110 (250) (120) (5) Net realizable value per stone A$550 A$180 A$105 X Number of stones per batch 70 105 175 Net realizable value per batch A$38,500 A$18,900 A$18,375 A$75,775 50.81% 24.94% 24.25% 100% Allocated cost to each grade A$17,784 A$8,729 A$8,488 A$35,000 Allocated joint cost per stone A$254.05 A$83.13 A$48.50 Percent of net realizable value per batch Total c. Which of the two methods to choose depends on how the numbers will ultimately be used. If they are used for decision making, one might be tempted to argue that NRV is better because it does not distort the relative profitability of the joint products. However, this answer is short sighted because it does not consider the possible tax affects of the alternative joint cost allocations. Presumably, whichever method Outback uses for internal purposes is likely to be seen by the tax authorities if Outback’s tax returns are audited. That is, although Outback can use different joint cost allocation methods for taxes and internal purposes, separate systems undermine Outback’s tax case if they are ever audited. The following tables calculate the income tax liability arising from each method. Income taxes based on number of stones: Revenue Grade I Grade II Grade III Total A$56,000 A$31,500 A$19,250 A$106,750 Allocated joint cost (based on number of stones) Additional packaging and selling cost Net income before taxes Income taxes (7,000) (10,500) (17,500) (35,000) (17,500) (12,600) (875) (30,975) 31,500 8,400 875 40,775 A$ 9,450 A$ 1,260 A$394 A$ 11,104 Income taxes based on NRV: Revenue A$56,000 A$31,500 A$19,250 A$106,750 Allocated joint cost (based on nrv) (17,784) (8,729) (8,488) (35,000) Additional packaging and selling cost (17,500) (12,600) (875) (30,975) 20,717 10,171 9,888 40,775 A$ 4,449 A$ 12,190 Net income before taxes Income taxes A$ 6,215 A$ 1,526 Notice, that the pre-tax cash flows are identical under the two joint cost allocation methods. Net income before taxes (and cash flows) is A$40,775. How the joint costs are allocated affects the amount of profit and hence taxes paid in each of the three countries, because the three tax jurisdictions have very different tax rates. The NRV method actually results in higher taxes than using the number of stones. Therefore, to minimize taxes, the number of stones should be used, assuming that it is an allowed method by all three tax jurisdictions. P 8-4: Solution to Mystic Herbals (30 minutes) a. Allocated joint cost is $60 per ounce ($30,000 ÷ 500 ounces): QV3 VX7 HM4 LZ9 % of batch by ounce 20% 16% 25% 39% Allocated joint cost $6,000 $4,800 $7,500 $11,700 b. Decisions to process further: Incremental revenue per ounce from further processing Number of ounces per batch Incremental revenue from further processing Cost of further processing Decision to process further c. VX7 $8 HM4 $25 LZ9 $14 100 $2,300 80 $640 125 $3,125 195 $2,730 $2,400 NO $400 YES $2,500 YES $2,800 NO QV3 VX7 HM4 LZ9 Total $6,200 0 $6,200 $4,560 400 $4,160 $15,875 $2,500 $13,375 $9,165 0 $9,165 $32,900 $30,000 $ 2,900 Profit after allocating joint cost using net realizable value: NRV % of NRV Allocated joint cost Net income per batch e. QV3 $23 Batches of Xubonic root should be produced because each batch yields profits of $3,200. Revenue from further processing or immediate sale Cost of further processing Net realizable value Joint cost of processing a batch Profit per batch d. Total 100% $30,000 QV3 $6,200 18.84% $5,653 $547 VX7 $4,160 12.64% $3,793 $367 HM4 $13,375 40.65% $12,196 $1,179 LZ9 $9,165 27.86% $8,357 $808 Total $32,900 100% $30,000 $2,900 Joint cost allocations do not enhance the decision to further process joint products. Net realizable value does not harm the decision process, but it does not add anything. The decisions in part (b) to process each joint product further or sell after the split off point were made without any joint cost allocations. P 8-9: (a) Solution to Murray Hill’s Untimely Demise (30 minutes) [Step-down allocations] The first step is to recompute the allocation percentages for the remaining service and operating departments. For example, when allocating B’s costs to C, D1, D2, and D3, you can not use the percentage of A’s use of B (8 percent) because this would allocate 8 percent of B back to A and then not all of B’s costs are allocated DOWN to the remaining departments. So C’s use of B is 15 percent/92 percent, or about 16.30 percent. Panel B recomputed the revised utilizations and Panel C completes poor Murray’s spreadsheet using these recomputed utilization percentages. Panel A: Utilization Data Service Dept. Cost $600,000 300,000 200,000 1,100,000 A B C A 5% 8% 15% Panel B: Revised Utilizations A 0 B 0 C 0 Service Departments B C 10% 20% 0% 15% 5% 7% 0.105263 0 0 0.210526 0.163043 0 Panel C: Completed Step-Down Allocations $600,000 A $0 $63,158 $126,316 $363,158 B $0 $0 $59,211 $385,527 C $0 $0 $0 b. D1 30% 22% 20% Operating Departments D2 D3 15% 20% 20% 35% 30% 23% Total 100% 100% 100% 0.315789 0.23913 0.273973 0.157895 0.217391 0.410959 0.210526 0.380435 0.315068 1.0000 1.0000 1.0000 $189,474 $86,842 $105,624 $381,940 $94,737 $78,947 $158,436 $332,120 $126,316 $138,158 $121,467 $385,941 $600,001 $363,158 $385,527 $1,100,001 The following table lists the dollar utilization of each service department (percentage utilized times the department costs) Service Dept. Cost 600000 300000 200000 A B C Service Departments A B C $30,000 $60,000 $120,000 $24,000 $0 $45,000 $30,000 $10,000 $14,000 Here we see that the three largest dollar utilizations are $120,000, $60,000, and $45,000. So the preferred step-down order should capture these large dollar flows. A should be allocated first in order that the $60,000 of B’s use of A and C’s $120,000 use of A are captured. B should be second in order to allocate the $45,000 of C’s use of B. Finally, C is allocated last. Thus, the preferred step-down order that captures the largest dollar utilizations is A, then B, and finally C. P 8–18: Solution to Bank Service Centers (40 minutes) [Reciprocal cost allocations] To begin, write down the three equations for service department costs. (1) (2) (3) E = $8.9 + 0.15 E + 0.10 C + 0.08 A C = $1.8 + 0.06 E + 0.04 A A = $6.4 + 0.32 E + 0.25 C + 0.12 A where E = EDP’s total reciprocal cost C = Copy Center’s total reciprocal cost A = Accounting’s total reciprocal cost. These three equations in three unknowns can be solved by linear algebra or matrix algebra. Both solutions are illustrated. The linear algebra solution is provided first. Substitute equation (2) into equations (1) and (3) to get two equations in two unknowns: (1) (3’) E = 8.9 + 0.15 E + 0.10 [1.8 + 0.06 E + 0.04 A] + 0.08 A 0.844 E = 9.08 + 0.084 A A = 6.4 + 0.32 E + 0.25 [1.8 + 0.06 E + 0.04 A] + 0.12 A 0.87 A = 6.85 + 0.335 E With two equations and two unknowns, solve equation (3’) for A and substitute into (1’): (3”) (1’) A = 7.874 + 0.385 E 0.844 E = 9.08 + 0.084 [7.874 + 0.385 E] E = $12.002 Substitute the value of E back into equation (3”) and solve for A: (3”) A = 7.874 + 0.385 (12.002) A = $12.495 Finally, substitute the values of A and E back into equation (2) and solve for C: (2) C = $1.8 + 0.06 (12.002) + 0.04 (12.495) C = $3.020 The values of A, C, and E can also be calculated using matrix algebra. Rewrite equations (1-3) after collecting like terms: (1) (2) (3) +0.85 E - 0.10 C - 0.08 A = $8.9 -0.06 E + 1.00 C - 0.04 A = $1.8 -0.32 E - 0.25 C + 0.88 A = $6.4 This system of three equations in three unknowns can be expressed in matrix form as: +0.85 -0.10 -0.08 E $8.9 -0.06 +1.00 -0.04 C -0.32 -0.25 +0.88 A = $1.8 $6.4 Solving for the vector of unknowns gives: E C A = +0.85 -0.10 -0.08 -0.06 +1.00 -0.04 -0.32 -0.25 +0.88 -1 $8.9 $1.8 $6.4 The inverse matrix is: +0.85 -0.10 -0.08 -0.06 +1.00 -0.04 -0.32 -0.25 +0.88 -1 = 1.232 0.153 0.119 0.093 1.023 0.055 0.474 0.346 1.195 Substituting the solution of the inverse into the preceding equation and solving yields: E C A = $12.002 $3.020 $12.495 The same values for E, C, and A are generated by matrix algebra as from linear algebra. The amounts for E, C, and A are then allocated to the service departments and operating divisions using the percentages given in the problem resulting in the following: Total Cost Cost to Div A,B,C EDP Copy Accounting Div. A Div. B Div. C EDP $1.80 $0.72 $3.84 $2.28 $1.56 $1.80 $12.00 $ 5.64 Copy Center $0.30 $0.00 $0.76 $0.76 $0.66 $0.54 $ 3.02 $ 1.96 Accounting $1.00 $0.50 $1.50 $3.75 $3.00 $2.75 $12.49* $ 9.50 $27.51 $17.10 * $.01 rounding difference. Notice that the amounts allocated to the three operating divisions exactly equals the total costs in the three service departments, $17.10 million. P 8–20: Solution to the Doe Company (40 minutes) [Joint costs with several downstream joint products] A diagram of the process is: Allocation of joint costs between sliced and crushed pineapples: Sliced $168,000 9,000 $177,000 Sales value 42,000 @ $4 (Sliced) 18,000 @ $.5 (Juice) Less: Selling cost of juice Additional costs (Dept. 3) (Dept. 4) (Dept. 2) Net realizable value at split-off Sliced Pineapple Crushed Pineapple $3,500 40,000 25,500 (18,000 @ $3) Crushed $54,000 ______ $54,000 69,000 $108,000 Estimated Net Realizable Value Percent $108,000 39,000 $147,000 73.47 26.53 100.00 15,000 $39,000 Allocation of Joint Costs $120,000 88,164 31,836 $120,000 P 8-30: a. Solution to IVAX (55 minutes) [Allocating service department costs] Direct allocation method: HR % Janitorial/Maintenance % HR allocations Janitorial/Maintenance allocations O1 57.89% 33.90% O2 42.11% 66.10% Total 100.00% 100.00% O1 $347.37 O2 $252.63 Total $600.00 $271.19 $618.55 $528.81 $781.45 $800.00 $1,400.00 b. Step-down allocation (Human Resource first) HR % Janitorial/Maintenance % HR allocations Janitorial/Maintenance allocations c. Janitorial/ Maintenance 5.00% $30.00 O1 55.00% 33.90% O2 40.00% 66.10% Total 100.00% 100.00% $330.00 $240.00 $600.00 $281.36 $548.64 $830.00 $611.36 $788.64 $1,430.00 Step-down allocation (Janitorial/Maintenance first) Janitorial/Maintenance % HR % Janitorial/Maintenance allocations HR allocations Human Resources 1.67% $13.33 O1 33.33% 57.89% O2 65.00% 42.11% Total 100.00% 100.00% $266.67 $355.09 $520.00 $258.25 $800.00 $613.33 $621.75 $778.25 $1,413.33 d. Cost per employee: i) ii) iii) Direct Allocation: $600,000 / 950 employees = $631.58 Step-down – Human Resources first: $600,000 / 1,000 employees = $600 Step-down – Janitorial/Maintenance first: ($600,000 + 13,333) / 950 = $645 e. Cost per square foot: i) Direct Allocation: $800,000 / 590 sq. ft. = $1,355.93 ii) Step-down – Human Resources first: $830,000 / 590 = $1,406.78 iii) Step-down – Janitorial/Maintenance first: $800,000 / 600 = $1,333.33 f. In considering how to (or even whether to) allocate the two service department costs, management should consider: Taxes. Will the allocations affect IVAX’s tax liability? Decision Making. How are key decisions in the firm, such as pricing and outsourcing affected by the allocated service department costs? If the purpose of the cost allocation is to provide accurate estimates of opportunity cost, then either one of the two step down methods more accurately captures the resource consumption pattern than the direct allocation method. Decision Control. If the purpose of the allocation is to change managers’ incentives (control) as to how they consume the service departments, then the allocation method with the highest tax rate will result in less of this department being utilized by the other divisions.
