6.RP.A.3c Lesson What's My Grade
advertisement

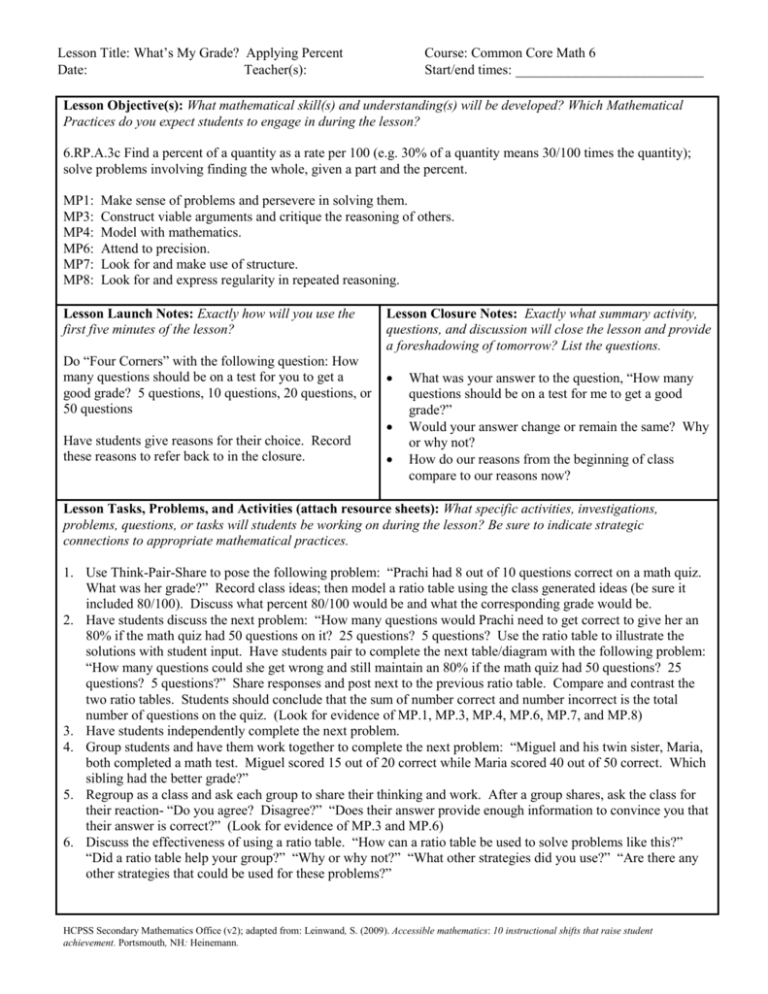
Lesson Title: What’s My Grade? Applying Percent Date: Teacher(s): Course: Common Core Math 6 Start/end times: _________________________ Lesson Objective(s): What mathematical skill(s) and understanding(s) will be developed? Which Mathematical Practices do you expect students to engage in during the lesson? 6.RP.A.3c Find a percent of a quantity as a rate per 100 (e.g. 30% of a quantity means 30/100 times the quantity); solve problems involving finding the whole, given a part and the percent. MP1: MP3: MP4: MP6: MP7: MP8: Make sense of problems and persevere in solving them. Construct viable arguments and critique the reasoning of others. Model with mathematics. Attend to precision. Look for and make use of structure. Look for and express regularity in repeated reasoning. Lesson Launch Notes: Exactly how will you use the first five minutes of the lesson? Do “Four Corners” with the following question: How many questions should be on a test for you to get a good grade? 5 questions, 10 questions, 20 questions, or 50 questions Lesson Closure Notes: Exactly what summary activity, questions, and discussion will close the lesson and provide a foreshadowing of tomorrow? List the questions. Have students give reasons for their choice. Record these reasons to refer back to in the closure. What was your answer to the question, “How many questions should be on a test for me to get a good grade?” Would your answer change or remain the same? Why or why not? How do our reasons from the beginning of class compare to our reasons now? Lesson Tasks, Problems, and Activities (attach resource sheets): What specific activities, investigations, problems, questions, or tasks will students be working on during the lesson? Be sure to indicate strategic connections to appropriate mathematical practices. 1. Use Think-Pair-Share to pose the following problem: “Prachi had 8 out of 10 questions correct on a math quiz. What was her grade?” Record class ideas; then model a ratio table using the class generated ideas (be sure it included 80/100). Discuss what percent 80/100 would be and what the corresponding grade would be. 2. Have students discuss the next problem: “How many questions would Prachi need to get correct to give her an 80% if the math quiz had 50 questions on it? 25 questions? 5 questions? Use the ratio table to illustrate the solutions with student input. Have students pair to complete the next table/diagram with the following problem: “How many questions could she get wrong and still maintain an 80% if the math quiz had 50 questions? 25 questions? 5 questions?” Share responses and post next to the previous ratio table. Compare and contrast the two ratio tables. Students should conclude that the sum of number correct and number incorrect is the total number of questions on the quiz. (Look for evidence of MP.1, MP.3, MP.4, MP.6, MP.7, and MP.8) 3. Have students independently complete the next problem. 4. Group students and have them work together to complete the next problem: “Miguel and his twin sister, Maria, both completed a math test. Miguel scored 15 out of 20 correct while Maria scored 40 out of 50 correct. Which sibling had the better grade?” 5. Regroup as a class and ask each group to share their thinking and work. After a group shares, ask the class for their reaction- “Do you agree? Disagree?” “Does their answer provide enough information to convince you that their answer is correct?” (Look for evidence of MP.3 and MP.6) 6. Discuss the effectiveness of using a ratio table. “How can a ratio table be used to solve problems like this?” “Did a ratio table help your group?” “Why or why not?” “What other strategies did you use?” “Are there any other strategies that could be used for these problems?” HCPSS Secondary Mathematics Office (v2); adapted from: Leinwand, S. (2009). Accessible mathematics: 10 instructional shifts that raise student achievement. Portsmouth, NH: Heinemann. Lesson Title: What’s My Grade? Applying Percent Course: Common Core Math 6 Date: Teacher(s): Start/end times: _________________________ Evidence of Success: What exactly do I expect students to be able to do by the end of the lesson, and how will I measure student success? That is, deliberate consideration of what performances will convince you (and any outside observer) that your students have developed a deepened and conceptual understanding. Students will be able to articulate and defend their choice based on finding the percent for each assessment (test or quiz) using ratio tables. They will be able to recognize that the number incorrect doesn’t yield the same grade due to the number of problems the assignment contains. Success will be measured through class participation and responses to the closure questions. Notes and Nuances: Vocabulary, connections, anticipated misconceptions (and how they will be addressed), etc. Typical Misconceptions: If a student only gets one question wrong on a graded assignment, it is still an “A”. Students need to realize that this is in proportion to the total number of problems an assignment contains. Miguel scored 15 out of 20 correct while Maria scored 40 out of 50 correct. Students may assume that Miguel has the better grade because he only had 5 incorrect while Maria had 10 incorrect. Connections: The connection students need to develop is the idea that assignments that are in proportion to one another yield the same grade. Resources: What materials or resources are essential for students to successfully complete the lesson tasks or activities? Homework: Exactly what follow-up homework tasks, problems, and/or exercises will be assigned upon the completion of the lesson? Student Resource Sheet Create a Student Homework Sheet similar to the classwork resource sheet or allow students to create a problem and solve using a ratio table. Lesson Reflections: How do you know that you were effective? What questions, connected to the lesson standards/objectives and evidence of success, will you use to reflect on the effectiveness of this lesson? What prior knowledge did the students display regarding percent and ratio tables? Were students able to determine the relationship between the number of correct problems compared to the total amount of problems and the percent grade? Could students conclude that the more problems an assignment has allows for more missed problems while maintaining a passing grade? Howard County Public Schools Office of Secondary Mathematics Curricular Projects has licensed this product under a Creative Commons Attribution-NonCommercial-NoDerivs 3.0 Unported License. HCPSS Secondary Mathematics Office (v2); adapted from: Leinwand, S. (2009). Accessible mathematics: 10 instructional shifts that raise student achievement. Portsmouth, NH: Heinemann.


