Investigating the effect of a, h and k on the graph of y = a(x – h)2 + k
advertisement
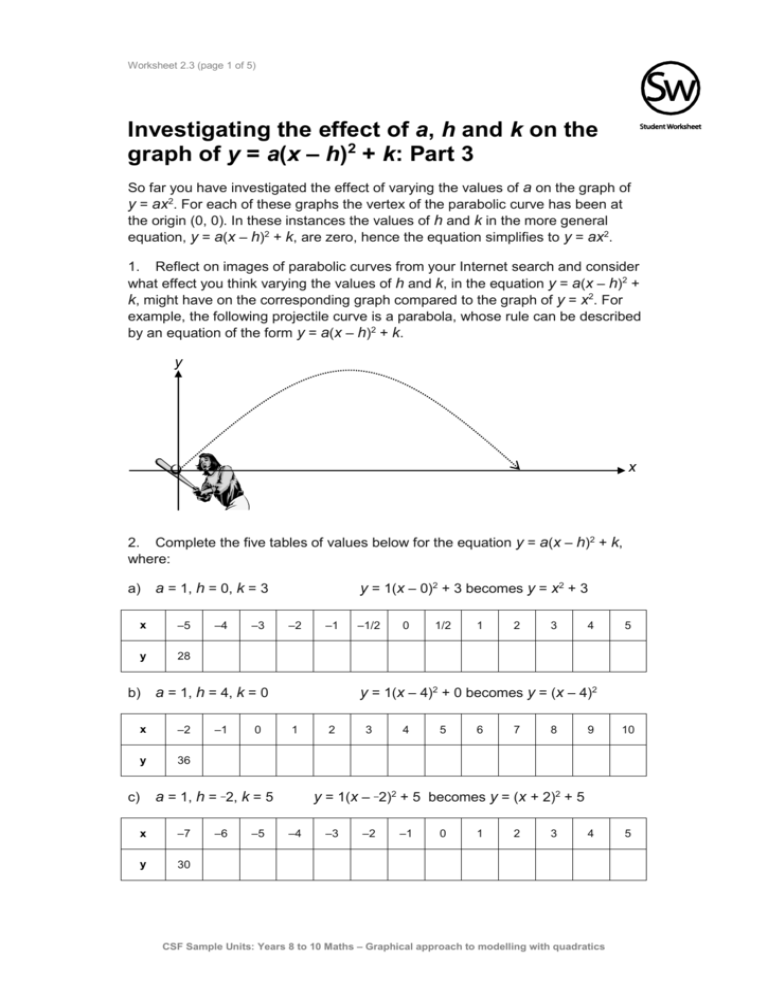
Worksheet 2.3 (page 1 of 5) Investigating the effect of a, h and k on the graph of y = a(x – h)2 + k: Part 3 So far you have investigated the effect of varying the values of a on the graph of y = ax2. For each of these graphs the vertex of the parabolic curve has been at the origin (0, 0). In these instances the values of h and k in the more general equation, y = a(x – h)2 + k, are zero, hence the equation simplifies to y = ax2. 1. Reflect on images of parabolic curves from your Internet search and consider what effect you think varying the values of h and k, in the equation y = a(x – h)2 + k, might have on the corresponding graph compared to the graph of y = x2. For example, the following projectile curve is a parabola, whose rule can be described by an equation of the form y = a(x – h)2 + k. y x 2. Complete the five tables of values below for the equation y = a(x – h)2 + k, where: a) x –5 y 28 b) y = 1(x – 0)2 + 3 becomes y = x2 + 3 a = 1, h = 0, k = 3 –4 –3 –2 –2 y 36 –1 0 1 –7 y 30 –6 –5 0 1/2 1 2 3 4 5 2 3 4 5 6 7 8 9 10 4 5 y = 1(x – –2)2 + 5 becomes y = (x + 2)2 + 5 a = 1, h = –2, k = 5 x –1/2 y = 1(x – 4)2 + 0 becomes y = (x – 4)2 a = 1, h = 4, k = 0 x c) –1 –4 –3 –2 –1 0 1 2 3 CSF Sample Units: Years 8 to 10 Maths – Graphical approach to modelling with quadratics Worksheet 2.3 (page 2 of 5) y = 1(x – –1)2 – 4 becomes y = (x + 1)2 – 4 a = 1, h = –1, k = –4 d) x –6 y 21 e) –5 –4 –3 –2 –5 y –66 –4 –3 0 1 2 3 4 5 y = –1(x – 3)2 – 2 becomes y = –(x – 3)2 – 2 a = –1, h = 3, k = –2 x –1 –2 –1 0 1 2 3 4 5 6 7 3. Draw each of the five sets of coordinates from question 2 onto one sheet of graph paper using the same set of axes for all five graphs. What effect does varying the value of k have on the graph of the parabolic curve? What effect does varying the value of h have on the graph of the parabolic curve? The values of h and k allow you to locate which specific point on the parabolic curve? 4. For each of the following equations draw a quick sketch by hand of the corresponding parabolic curve, labeling the coordinates of the vertex and showing whether the vertex is on top or on the bottom. CSF Sample Units: Years 8 to 10 Maths – Graphical approach to modelling with quadratics Worksheet 2.3 (page 3 of 5) For example: (–4, 5) y = –(x + 4)2 + 5 Vertex at (–4, 5). a) y = (x – 2)2 b) y = (x + 5)2 c) y = x2 – 4 d) y = (x – 1)2 – 1 e) y = (x + 1)2 + 5 f) y = –(x – 3)2 + 2 g) y = –(x + 7)2 – 10 h) y = (x – 11)2 + 13 5. Using a graphing tool, such as a graphics calculator or computer software package: a) Draw the corresponding graph of each of the equations in question 4 to check if your sketch is accurate. Draw different graphs of the types y = a(x – h)2 + k, varying the values of a, h and k. Draw 4–8 graphs on the same set of axes to enable comparisons to be made between them. Observe the relationship between the values of a, h and k and the curves obtained. See if you are able to predict what the graph will look like. b) 6. For each of the following equations write down the values of a, h and k. Then draw a quick sketch by hand of the corresponding parabolic curve, labelling the coordinates of the vertex, showing whether the vertex is on top or on the bottom and drawing the parabolic curve wider or narrower depending on the value of a. Note: Take particular care when writing the value of h, why? a) y = 0.2x2 – 3 a= h= k= b) y = –10(x – 4)2 a= h= k= CSF Sample Units: Years 8 to 10 Maths – Graphical approach to modelling with quadratics Worksheet 2.3 (page 4 of 5) c) y = 3(x + 5)2 + 7 d) y = –0.4(x – 3)2 – 6 a= h= a= k= h= k= 7. Write the equation for each graph below, given the value of a for each graph is either 1 or –1. a) vertex: ( , ) a = 1 or –1 cross out incorrect value y= b) vertex: ( , ) a = 1 or –1 cross out incorrect value y= c) vertex: ( , ) a = 1 or –1 cross out incorrect value y= CSF Sample Units: Years 8 to 10 Maths – Graphical approach to modelling with quadratics Worksheet 2.3 (page 5 of 5) d) vertex: ( , ) a = 1 or –1 cross out incorrect value y= e) vertex: ( , ) a = 1 or –1 cross out incorrect value y= f) vertex: ( , ) a = 1 or –1 cross out incorrect value y= CSF Sample Units: Years 8 to 10 Maths – Graphical approach to modelling with quadratics
