Lesson Plan Title - commoncorealgebra1
advertisement

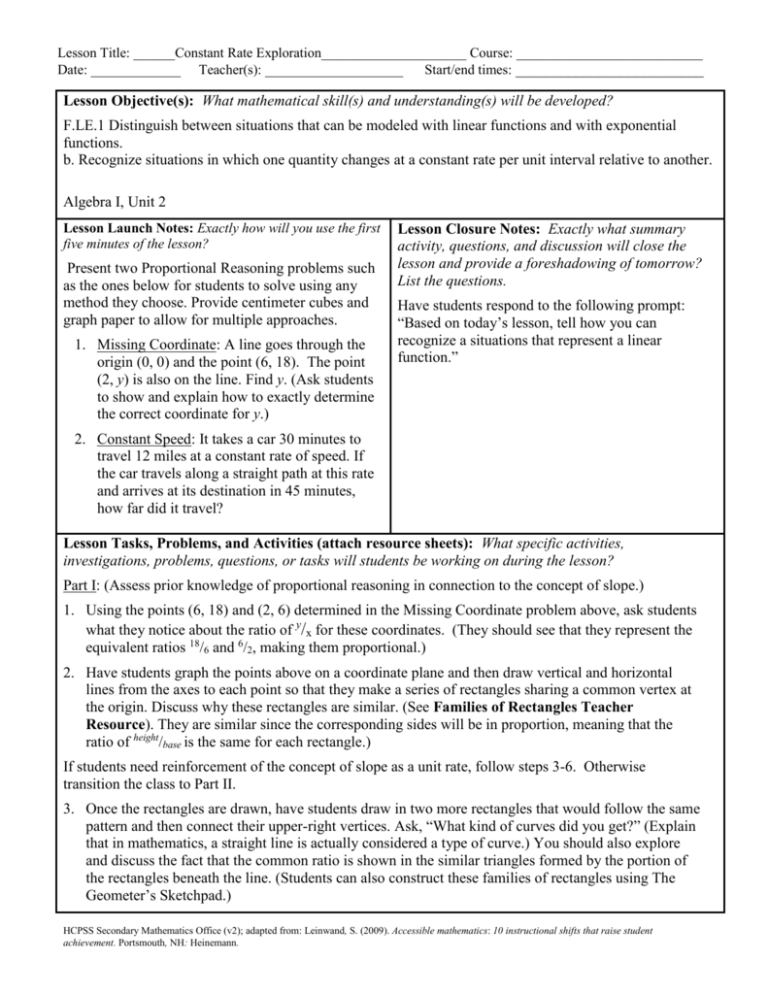
Lesson Title: ______Constant Rate Exploration_____________________ Course: ___________________________ Date: _____________ Teacher(s): ____________________ Start/end times: _________________________ Lesson Objective(s): What mathematical skill(s) and understanding(s) will be developed? F.LE.1 Distinguish between situations that can be modeled with linear functions and with exponential functions. b. Recognize situations in which one quantity changes at a constant rate per unit interval relative to another. Algebra I, Unit 2 Lesson Launch Notes: Exactly how will you use the first five minutes of the lesson? Present two Proportional Reasoning problems such as the ones below for students to solve using any method they choose. Provide centimeter cubes and graph paper to allow for multiple approaches. 1. Missing Coordinate: A line goes through the origin (0, 0) and the point (6, 18). The point (2, y) is also on the line. Find y. (Ask students to show and explain how to exactly determine the correct coordinate for y.) Lesson Closure Notes: Exactly what summary activity, questions, and discussion will close the lesson and provide a foreshadowing of tomorrow? List the questions. Have students respond to the following prompt: “Based on today’s lesson, tell how you can recognize a situations that represent a linear function.” 2. Constant Speed: It takes a car 30 minutes to travel 12 miles at a constant rate of speed. If the car travels along a straight path at this rate and arrives at its destination in 45 minutes, how far did it travel? Lesson Tasks, Problems, and Activities (attach resource sheets): What specific activities, investigations, problems, questions, or tasks will students be working on during the lesson? Part I: (Assess prior knowledge of proportional reasoning in connection to the concept of slope.) 1. Using the points (6, 18) and (2, 6) determined in the Missing Coordinate problem above, ask students what they notice about the ratio of y/x for these coordinates. (They should see that they represent the equivalent ratios 18/6 and 6/2, making them proportional.) 2. Have students graph the points above on a coordinate plane and then draw vertical and horizontal lines from the axes to each point so that they make a series of rectangles sharing a common vertex at the origin. Discuss why these rectangles are similar. (See Families of Rectangles Teacher Resource). They are similar since the corresponding sides will be in proportion, meaning that the ratio of height/base is the same for each rectangle.) If students need reinforcement of the concept of slope as a unit rate, follow steps 3-6. Otherwise transition the class to Part II. 3. Once the rectangles are drawn, have students draw in two more rectangles that would follow the same pattern and then connect their upper-right vertices. Ask, “What kind of curves did you get?” (Explain that in mathematics, a straight line is actually considered a type of curve.) You should also explore and discuss the fact that the common ratio is shown in the similar triangles formed by the portion of the rectangles beneath the line. (Students can also construct these families of rectangles using The Geometer’s Sketchpad.) HCPSS Secondary Mathematics Office (v2); adapted from: Leinwand, S. (2009). Accessible mathematics: 10 instructional shifts that raise student achievement. Portsmouth, NH: Heinemann. Lesson Title: ______Constant Rate Exploration_____________________ Course: ___________________________ Date: _____________ Teacher(s): ____________________ Start/end times: _________________________ 4. Have students create a table of values showing x, y, and y/x for the pattern shown and write an equation for the line graphed or describe it in words. Ask what this rate is called for a line. (slope) 5. In pairs, have students create and explore at least three other similar families of rectangles drawn on separate axes and then show the patterns that emerge numerically, in a table, and in an equation to further emphasize the relationship between the equivalent ratios and the slope of the line. 6. Have students summarize their work and share their results with the class. Ask them what all of these graphs have in common. (They are all linear and the variables show a constant rate of change per unit interval relative to one another. Also tell students that in each of these cases, the linear functions are all examples of direct variation functions that always have a y-intercept of zero.) (Adapted from Discovering Algebra, 2007, p. 131 “Families of Rectangles”.) Part II: 1. Place student in cooperative groups in order to do an activity where they match “tub stories” to different graphical representations showing how the volume of water in a tub changes over time. 2. Put each “tub story” on a different index card and have the student groups discuss which graph they think each one matches on the Constant Rate Recognition activity. 3. Post each graphical representation of the tub scenario on separate sheets of chart paper, and ask the groups to tape index card with the story they think matches each graph on the chart paper. 4. Have the class view the group solutions to the matching activity and discuss their conclusions, emphasizing which situations are linear (showing a constant rate of change for V relative to t) and which are exponential. 5. Ask students to return to their groups and complete a PETS sheet for one of the linear functions and one of the exponential functions they considered in this activity. They will enhance the tub stories by making up their own numbers to complete a table of values that could correspond with the graphs. 6. Have students individually respond to the prompt in the lesson closure. Evidence of Success: What exactly do I expect students to be able to do by the end of the lesson, and how will I measure student mastery? That is, deliberate consideration of what performances will convince you (and any outside observer) that your students have developed a deepened (and conceptual) understanding. By the end of the lesson, students should be able to recognize situations involving a constant rate of change as linear functions versus exponential. Notes and Nuances: Vocabulary, connections, common mistakes, typical misconceptions, etc. Vocabulary: Proportional, Rate, Constant Rate, Linear, Exponential, Function, Direct Variation Be sure that students make the connection between proportionality of corresponding sides and the constant rate of change (slope) shown for the linear function in the graph. Students should understand proportions but may not recognize that the concept of slope is based on proportional reasoning. Build on this prior knowledge from Common Core 8 in order to help students distinguish between situations that can be modeled with linear functions from those that are exponential. HCPSS Secondary Mathematics Office (v2); adapted from: Leinwand, S. (2009). Accessible mathematics: 10 instructional shifts that raise student achievement. Portsmouth, NH: Heinemann. Lesson Title: ______Constant Rate Exploration_____________________ Course: ___________________________ Date: _____________ Teacher(s): ____________________ Start/end times: _________________________ Resources: What materials or resources are essential for students to successfully complete the lesson tasks or activities? Graph paper Centimeter Cubes Graphing calculators Rulers Pens, pencils, and/or markers Homework: Exactly what follow-up homework tasks, problems, and/or exercises will be assigned upon the completion of the lesson? To further explore the concept of constant rate of change for real-world situations involving linear functions that have a y-intercept other than zero, have students solve the following problem: A local pizza place charges $5.99 for a plain 8-inch pizza. Extra Topping Items cost a set price each. The graph containing points relating the number of toppings and the cost of a plain 8-inch pizza at this restaurant is a line that goes through points (0, 5.99) and (6, 10.49). The point (2, y) is also on the line. Find y. How much does the restaurant charge for each additional topping? A complete response includes: a) work CLEARLY shown so that other students could understand it; b) an appropriate equation (or expression); c) some OTHER method of solving the problem besides an equation, such as a picture, table, graph, guess and check, arithmetic, etc.; and d) the solution to the question. 2. Have students complete graphic organizers, e.g. a Frayer model (see below), to compare and contrast linear and exponential functions. Lesson Reflections: What questions, connected to the lesson objectives and evidence of success, will you use to reflect on the effectiveness of this lesson? Were students able to grasp the concept of slope as a constant rate of change per unit between two quantities relative to each other more readily as a result of using this approach? Are students able to extend their understanding of proportional reasoning to linear relationships and slope for both direct variation situations and those involving non-zero y-intercepts? What are the next steps that I need to take to bridge student understanding of how to recognize linear functions and distinguish them from other functions before introducing exponential growth and decay? HCPSS Secondary Mathematics Office (v2); adapted from: Leinwand, S. (2009). Accessible mathematics: 10 instructional shifts that raise student achievement. Portsmouth, NH: Heinemann. Lesson Title: ______Constant Rate Exploration_____________________ Course: ___________________________ Date: _____________ Teacher(s): ____________________ Start/end times: _________________________ Definition (in words or graph form) Characteristics Linear Functions Examples (equations) Non-Examples HCPSS Secondary Mathematics Office (v2); adapted from: Leinwand, S. (2009). Accessible mathematics: 10 instructional shifts that raise student achievement. Portsmouth, NH: Heinemann. Lesson Title: ______Constant Rate Exploration_____________________ Course: ___________________________ Date: _____________ Teacher(s): ____________________ Start/end times: _________________________ Definition (in words or graph form) Examples (equations) Exponential Functions Characteristics Non-Examples HCPSS Secondary Mathematics Office (v2); adapted from: Leinwand, S. (2009). Accessible mathematics: 10 instructional shifts that raise student achievement. Portsmouth, NH: Heinemann.


