worksheets
advertisement
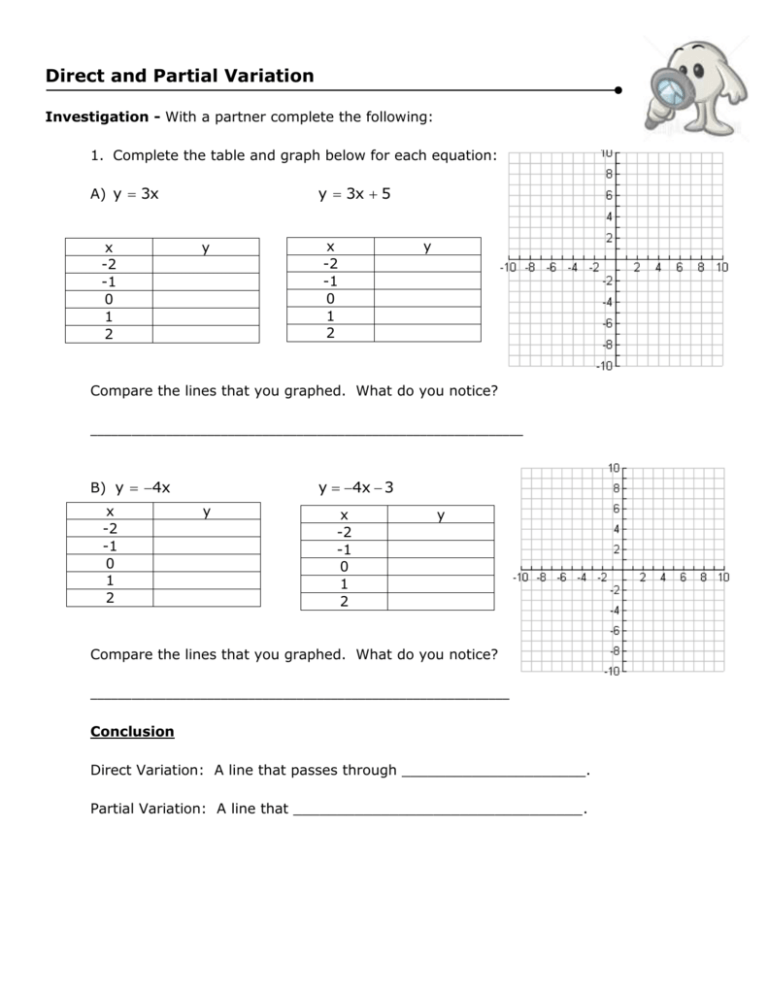
Direct and Partial Variation Investigation - With a partner complete the following: 1. Complete the table and graph below for each equation: A) y 3x x -2 -1 0 1 2 y 3x 5 y x -2 -1 0 1 2 y Compare the lines that you graphed. What do you notice? _______________________________________________________________ B) y 4x x -2 -1 0 1 2 y 4x 3 y x -2 -1 0 1 2 y Compare the lines that you graphed. What do you notice? _____________________________________________________________ Conclusion Direct Variation: A line that passes through _____________________. Partial Variation: A line that _________________________________. 2. Circle all equations that represent partial variation. a) y 5x 2 b) y 6x c) y 7x 2 d) y 3. Circle all graphs that represent direct variation. b) c) a) 1 x 2 d) 4. Identify each table as direct or partial variation. Justify your response. a) b) c) d) x 0 1 2 3 4 5 y 4 8 12 16 24 28 x 0 1 2 3 4 5 y 0 -3 -6 -9 -12 -15 Table Direct Variation Partial Variation x -2 -1 0 1 2 3 y -3 1 5 9 13 17 Graph x -2 -1 0 1 2 3 y 10 5 0 -5 -10 -15 Equation Homework: A taxicab driver charges $2.50 plus $0.50/km for each trip. a) What is the dependent variable (y)? ___________________________ b) What is the independent variable (x)? __________________________ c) Write the equation for this relationship. ___________ d) Make a table of values. x Y Independent Variable Dependent Variable 0 2 4 6 e) Graph this relation. f) Use the graph to predict the cost of a 5km trip. ____________ This is called __________________ g) Use the graph to predict the cost of an 8 km trip. ____________ This is called __________________ h) Use the equation to check your answer 5 km trip 8 km trip i) On the graph, where is the fixed cost? j) Describe the graph. The graph of a partial variation is a _________________ _____________ that _________ _________ the origin (0, 0). Homework: A piano instructor charges $20/h. a) What is the dependent variable (y)? ___________________________ b) What is the independent variable (x)? __________________________ c) Write the equation for this relationship. _______________________ d) Make a table of values. x Y Independent Variable Dependent Variable 0 2 4 6 e) Graph this relation. f) Use the graph to predict the cost of a 5 hour 200 lesson. ____________ 180 This is called __________________ 160 140 g) Use the graph to predict the cost of a 7 hour 120 100 lesson. ____________ This is called __________________ 80 60 h) Use the equation to check your answer 5 hour lesson 7 hour lesson 40 20 1 i) 2 3 4 5 6 7 8 9 10 Describe the graph. The graph of a direct variation is a _________________ _____________ that _________ _________ the origin (0, 0). Direct Variation Partial Variation

