View article
advertisement
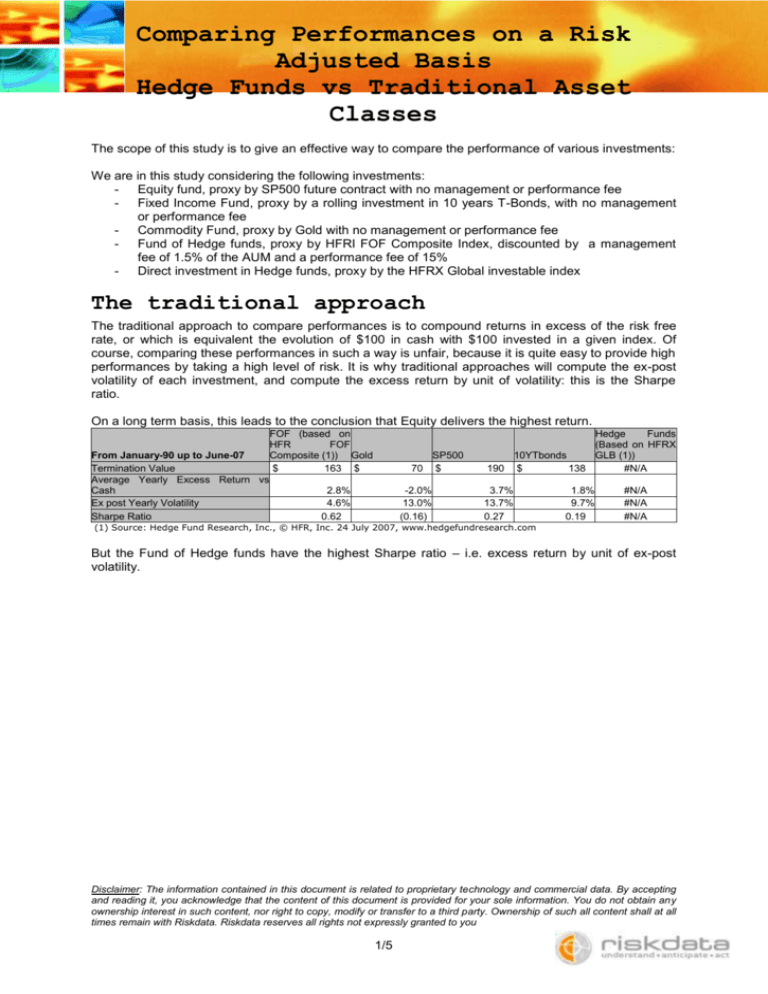
Comparing Performances on a Risk Adjusted Basis Hedge Funds vs Traditional Asset Classes The scope of this study is to give an effective way to compare the performance of various investments: We are in this study considering the following investments: - Equity fund, proxy by SP500 future contract with no management or performance fee - Fixed Income Fund, proxy by a rolling investment in 10 years T-Bonds, with no management or performance fee - Commodity Fund, proxy by Gold with no management or performance fee - Fund of Hedge funds, proxy by HFRI FOF Composite Index, discounted by a management fee of 1.5% of the AUM and a performance fee of 15% - Direct investment in Hedge funds, proxy by the HFRX Global investable index The traditional approach The traditional approach to compare performances is to compound returns in excess of the risk free rate, or which is equivalent the evolution of $100 in cash with $100 invested in a given index. Of course, comparing these performances in such a way is unfair, because it is quite easy to provide high performances by taking a high level of risk. It is why traditional approaches will compute the ex-post volatility of each investment, and compute the excess return by unit of volatility: this is the Sharpe ratio. On a long term basis, this leads to the conclusion that Equity delivers the highest return. From January-90 up to June-07 Termination Value Average Yearly Excess Return vs Cash Ex post Yearly Volatility Sharpe Ratio FOF (based on HFR FOF Composite (1)) Gold $ 163 $ 70 2.8% 4.6% 0.62 -2.0% 13.0% (0.16) SP500 $ Hedge Funds (Based on HFRX 10YTbonds GLB (1)) 190 $ 138 #N/A 3.7% 13.7% 0.27 1.8% 9.7% 0.19 #N/A #N/A #N/A (1) Source: Hedge Fund Research, Inc., © HFR, Inc. 24 July 2007, www.hedgefundresearch.com But the Fund of Hedge funds have the highest Sharpe ratio – i.e. excess return by unit of ex-post volatility. Disclaimer: The information contained in this document is related to proprietary technology and commercial data. By accepting and reading it, you acknowledge that the content of this document is provided for your sole information. You do not obtain any ownership interest in such content, nor right to copy, modify or transfer to a third party. Ownership of such all content shall at all times remain with Riskdata. Riskdata reserves all rights not expressly granted to you 1/5 Comparing Performances on a Risk Adjusted Basis Hedge Funds vs Traditional Asset Classes Excess Wealth vs Cash from January-90 up to June-07 300 250 FOF (based on HFR FOF Composite (1)) Gold SP500 10YTbonds 200 150 100 50 (1) Source: Hedge Fund Research, Inc., © HFR, Inc. 24 July 2007, www.hedgefundresearch.com Ju D ec -8 9 nD 90 ec -9 Ju 0 nD 91 ec -9 Ju 1 nD 92 ec -9 Ju 2 nD 93 ec -9 Ju 3 nD 94 ec -9 Ju 4 nD 95 ec -9 Ju 5 nD 96 ec -9 Ju 6 nD 97 ec -9 Ju 7 nD 98 ec -9 Ju 8 nD 99 ec -9 Ju 9 nD 00 ec -0 Ju 0 nD 01 ec -0 Ju 1 nD 02 ec -0 Ju 2 nD 03 ec -0 Ju 3 nD 04 ec -0 Ju 4 nD 05 ec -0 Ju 5 nD 06 ec -0 Ju 6 n07 0 If we consider the most recent time windows – the last four years, i.e. the equity & commodity rally, equity seem apparently to be superior both in term of excess return and Sharpe ratio: From April-03 up to June-07 Termination Value Average Yearly Excess Return vs Cash Ex post Yearly Volatility Sharpe Ratio FOF (based on HFR FOF Composite (1)) $ 118 Gold $ 4.1% 3.1% 1.32 169 13.2% 14.5% 0.91 SP500 $ 154 10YTbonds $ 87 Hedge Funds (Based on HFRX GLB (1)) $ 108 10.7% 8.2% 1.30 -3.3% 9.8% (0.33) 1.9% 3.2% 0.58 Investing in Gold was what delivers the highest return, but by taking a significantly higher risk. Investing in Fund of Hedge Funds is a low return / low risk investment, with a Sharpe ratio just below that of the SP500. It is a significantly better investment than a direct investment in hedge funds. The fact that the HFR index is not investable – and therefore benefit from the so call “survival bias” – doesn’t explain the performance gap: the death rate among Fund of hedge funds is very low. Therefore, the main explanation for this performance gap is the added value FoHF bring in term of manager selections (they tend to select the best one) and allocation (they actively manage allocations to take advantage of the trends). So the conclusion of this approach would be that integrating in the comparison gap in volatilities and excluding major equity crisis, a traditional equity fund is the best investment, while a fund of hedge fund is the best “crisis” proof investment. Why traditional sufficient approaches are not The problem is that it is not at all operational for an investor. It does not give to the investor an understanding of which amount of money he would have actually make for each unit of risk. Because Disclaimer: The information contained in this document is related to proprietary technology and commercial data. By accepting and reading it, you acknowledge that the content of this document is provided for your sole information. You do not obtain any ownership interest in such content, nor right to copy, modify or transfer to a third party. Ownership of such all content shall at all times remain with Riskdata. Riskdata reserves all rights not expressly granted to you 2/5 Comparing Performances on a Risk Adjusted Basis Hedge Funds vs Traditional Asset Classes when something has happened (a crisis, a draw down) it is no longer risk, it is performances. But in real life situation, risk is what may happen in the future, not what happen in the past. Let’s take an analogy to illustrate the problem. You have to choose between 2 transportation means to go from home to the office: motorbike or car. The performance is the time it requires. The risk is the probability of having an accident. On the one hand, Alicia recommends you to choose the motorbike, because she uses it every day to get to the office, it takes her 30 min to cover 20 miles, the distance from home to work, she has been doing that for now 5 years and never got a serious accident. On the other hand, Alex claims that the car is superior because it takes him 1 hr to cover 20 miles from home to work, he has been doing that every day for 5 years as well and never had an accident. Looking backward, Alicia looks correct because the motorbike is faster. However, looking forward, the probability of an accident and its consequences are far more dramatic with the motorbike than with the car (considering any statistics). In order for Alicia to reduce her risk to that of the car, she needs to slow down by at least a factor 3. So, if we compare transportation means with equivalent level of risk, Alex is now faster than Alicia, who needs 1½ hrs to safely ride her motorbike from home to work. Using Investable performances Strategies to compare The solution is in fact to simulate a looking forward basis, at every time on the period, in order to take the same level of risk whatever the selected asset class, exactly as a rational investor would actually behave. It consists in having a risk target (in our case, a 10% ex ante volatility) and then: - Every month, estimate the forthcoming risk of each index, using an “ex-ante” risk indicator - Adjust leverage on the index, i.e. leave part of the investment in cash or borrow cash, so that the “ex-ante” risk indicator is set equal to 10%. Of course, borrowing cash requires paying the risk free rate + spread (set to 15bps in our study). On the contrary, cash is invested at the risk free rate – which in fact turns out to penalise low volatility strategies. Note that, except for the 15 bps spread, leveraging the investment or keeping part of the cash in money markets has no impact on the Sharpe ratio when the leverage is fixed. However, this is no longer the case with a varying leverage. One can now compare the performances of these “automatically leveraged” investment vehicles, which are what an investor would actually get when investing into risk adjusted strategies. From January-90 up to June-07 Termination Value Average Yearly Excess Return vs Cash Ex post Yearly Volatility Sharpe Ratio FOF (based on HFR FOF Composite (1)) Gold $ 467 $ 9.2% 10.9% 0.85 68 -2.2% 11.0% (0.20) SP500 $ 204 4.2% 10.5% 0.40 10YTbonds $ 162 2.8% 11.0% 0.25 Hedge Funds (Based on HFRX GLB (1)) #N/A #N/A #N/A #N/A Disclaimer: The information contained in this document is related to proprietary technology and commercial data. By accepting and reading it, you acknowledge that the content of this document is provided for your sole information. You do not obtain any ownership interest in such content, nor right to copy, modify or transfer to a third party. Ownership of such all content shall at all times remain with Riskdata. Riskdata reserves all rights not expressly granted to you 3/5 Comparing Performances on a Risk Adjusted Basis Hedge Funds vs Traditional Asset Classes Excess Wealth vs Cash from January-90 up to June-07 300 250 FOF (based on HFR FOF Composite (1)) Gold SP500 10YTbonds 200 150 100 50 (1) Source: Hedge Fund Research, Inc., © HFR, Inc. 24 July 2007, www.hedgefundresearch.com Ju D ec -8 9 nD 90 ec -9 Ju 0 nD 91 ec -9 Ju 1 nD 92 ec -9 Ju 2 nD 93 ec -9 Ju 3 nD 94 ec -9 Ju 4 nD 95 ec -9 Ju 5 nD 96 ec -9 Ju 6 nD 97 ec -9 Ju 7 nD 98 ec -9 Ju 8 nD 99 ec -9 Ju 9 nD 00 ec -0 Ju 0 nD 01 ec -0 Ju 1 nD 02 ec -0 Ju 2 nD 03 ec -0 Ju 3 nD 04 ec -0 Ju 4 nD 05 ec -0 Ju 5 nD 06 ec -0 Ju 6 n07 0 On the long term, Fund of hedge funds is by far the best choice. Initial investment is multiplied by 4.5, against only double for an equity investment, which comes second, more or less similar to a bond investment. One can also look at traditional indicators, such as Sharpe ratio. By forcing the “ex-ante” volatility at a given level, we see that the ex-post volatility is almost the same for the various investments. Hence the Sharpe ratio ranking coincides with that of the performance. On a more recent period – during the equity and commodity rally, we again find, based on this approach, that Fund of Hedge Funds perform similarly to equities and gold and beat other investments. From April-03 up to June-07 Termination Value Average Yearly Excess Return vs Cash Ex post Yearly Volatility Sharpe Ratio FOF (based on HFR FOF Composite (1)) Gold $ 168 $ 13.0% 9.6% 1.35 144 9.0% 9.9% 0.91 SP500 $ 156 11.0% 9.5% 1.16 10YTbonds $ 85 -3.8% 9.5% (0.40) Hedge Funds (Based on HFRX GLB (1)) $ 121 4.5% 10.5% 0.43 Disclaimer: The information contained in this document is related to proprietary technology and commercial data. By accepting and reading it, you acknowledge that the content of this document is provided for your sole information. You do not obtain any ownership interest in such content, nor right to copy, modify or transfer to a third party. Ownership of such all content shall at all times remain with Riskdata. Riskdata reserves all rights not expressly granted to you 4/5 Comparing Performances on a Risk Adjusted Basis Hedge Funds vs Traditional Asset Classes Excess Wealth / Cash for risk adjusted strategies from April-03 up to June-07 180 FOF (based on HFR FOF Composite (1)) Gold SP500 10YTbonds Hedge Funds (Based on HFRX GLB (1)) 160 140 120 100 80 60 40 20 (1) Source: Hedge Fund Research, Inc., © HFR, Inc. 24 July 2007, www.hedgefundresearch.com M M ar -0 3 ay -0 3 Ju l-0 3 Se p03 N ov -0 3 Ja n04 M ar -0 4 M ay -0 4 Ju l-0 4 Se p04 N ov -0 4 Ja n05 M ar -0 5 M ay -0 5 Ju l-0 5 Se p05 N ov -0 5 Ja n06 M ar -0 6 M ay -0 6 Ju l-0 6 Se p06 N ov -0 6 Ja n07 M ar -0 7 M ay -0 7 0 In conclusion, on a risk-adjusted basis, Fund of Hedge Funds match the best performance of traditional investments – equities, bonds, commodities – when they rally, and on a long term period, deliver far superior performances, because they are “crisis proof”. ________________ Disclaimer: The information contained in this document is related to proprietary technology and commercial data. By accepting and reading it, you acknowledge that the content of this document is provided for your sole information. You do not obtain any ownership interest in such content, nor right to copy, modify or transfer to a third party. Ownership of such all content shall at all times remain with Riskdata. Riskdata reserves all rights not expressly granted to you 5/5
