Rate-of-Change/Slope Worksheet
advertisement

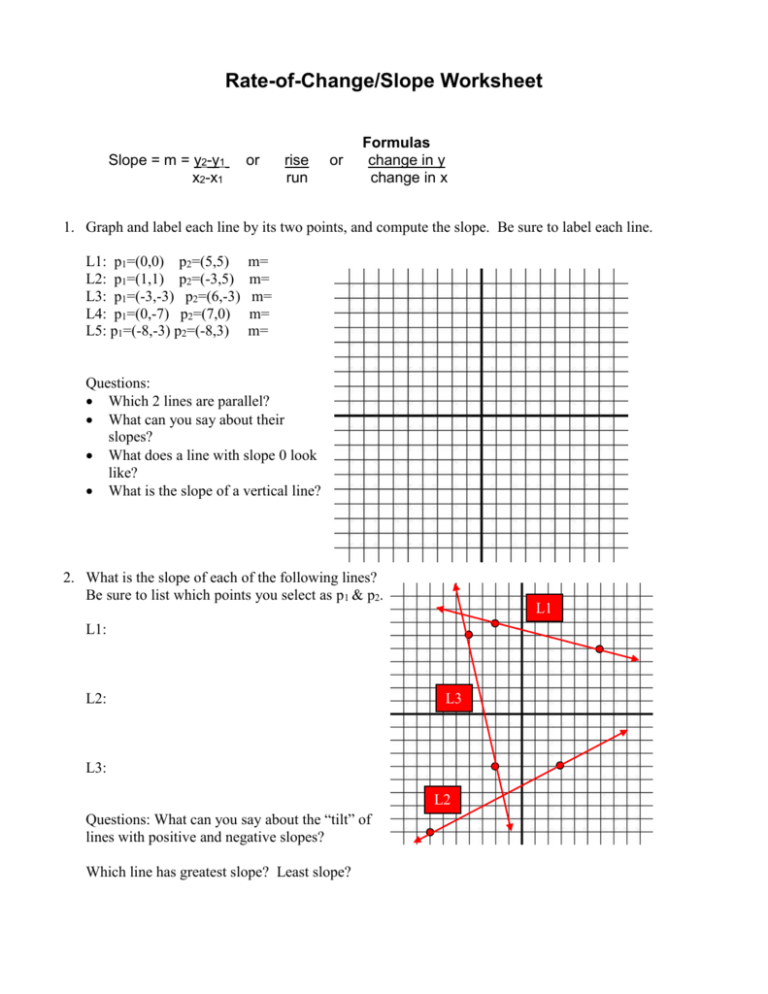
Rate-of-Change/Slope Worksheet Slope = m = y2-y1 x2-x1 or rise run or Formulas change in y change in x 1. Graph and label each line by its two points, and compute the slope. Be sure to label each line. L1: p1=(0,0) p2=(5,5) L2: p1=(1,1) p2=(-3,5) L3: p1=(-3,-3) p2=(6,-3) L4: p1=(0,-7) p2=(7,0) L5: p1=(-8,-3) p2=(-8,3) m= m= m= m= m= Questions: Which 2 lines are parallel? What can you say about their slopes? What does a line with slope 0 look like? What is the slope of a vertical line? 2. What is the slope of each of the followings lines? Be sure to list which points you select as p1 & p2. L1 L1: L3 L2: L3: L2 Questions: What can you say about the “tilt” of lines with positive and negative slopes? d Which line has greatest slope? Least slope? 3. Challenge Question: Consider the following data from USA Today on the number of students applying to colleges using the “early admission” option. Make a scatter plot of the 7 points, draw a straight line that seems to be a best fit, determine the slope of this line, and make a prediction for 2005-6. d d


