Review Questions
advertisement
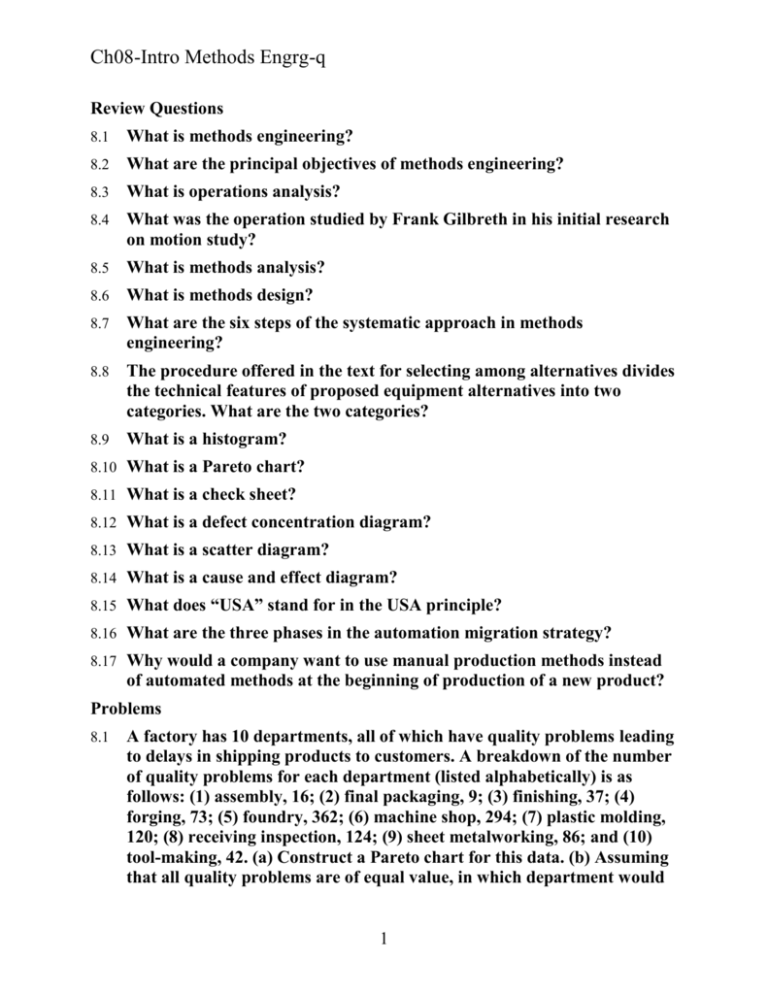
Ch08-Intro Methods Engrg-q Review Questions 8.1 What is methods engineering? 8.2 What are the principal objectives of methods engineering? 8.3 What is operations analysis? 8.4 What was the operation studied by Frank Gilbreth in his initial research on motion study? 8.5 What is methods analysis? 8.6 What is methods design? 8.7 What are the six steps of the systematic approach in methods engineering? 8.8 The procedure offered in the text for selecting among alternatives divides the technical features of proposed equipment alternatives into two categories. What are the two categories? 8.9 What is a histogram? 8.10 What is a Pareto chart? 8.11 What is a check sheet? 8.12 What is a defect concentration diagram? 8.13 What is a scatter diagram? 8.14 What is a cause and effect diagram? 8.15 What does “USA” stand for in the USA principle? 8.16 What are the three phases in the automation migration strategy? 8.17 Why would a company want to use manual production methods instead of automated methods at the beginning of production of a new product? Problems 8.1 A factory has 10 departments, all of which have quality problems leading to delays in shipping products to customers. A breakdown of the number of quality problems for each department (listed alphabetically) is as follows: (1) assembly, 16; (2) final packaging, 9; (3) finishing, 37; (4) forging, 73; (5) foundry, 362; (6) machine shop, 294; (7) plastic molding, 120; (8) receiving inspection, 124; (9) sheet metalworking, 86; and (10) tool-making, 42. (a) Construct a Pareto chart for this data. (b) Assuming that all quality problems are of equal value, in which department would 1 Ch08-Intro Methods Engrg-q you start to take corrective action to reduce the quality problems? (c) Determine the percentage of total quality problems that are attributable to the two departments (20% of the departments) with the most quality problems. 8.2 Using your answer to part (c) of the preceding problem, (a) determine the parameter A in Eq. (8.1) representing the Pareto cumulative distribution. Use 20% of the departments as the x value in your computations. (b) Construct the idealized Pareto chart based on your answer to part (a) and discuss the comparison between this idealized chart and the actual data in the previous problem. Use a spreadsheet program to calculate the data for part (b). 8.3 Assume that 75% of the sales in a retail company are accounted for by 25% of the customers. (a) Determine the parameter A in the Pareto cumulative distribution equation. (b) Given that the relationship is valid for the remaining sales, how much of the sales value is accounted for by 50% of the customers? 8.4 The inventory policy of a retail company is to hold only the highest sales volume items in its distribution center and to ship the remaining lower sales volume items direct from the respective manufacturers to its stores. This policy is intended to reduce transportation costs. Total annual sales of the company are $1 billion. It is known that half of this amount is accounted for by only 15% of the items. In addition, it is assumed that equation (8.1) in the text can be used to model the Pareto cumulative distribution. (a) If the company wants to stock the top selling 35% of the items in the distribution center, what is the expected value of these items in terms of annual sales? (b) On the other hand, if the company wants to stock only those items accounting for the top 75% of annual sales, what proportion of the items corresponds to this sales volume? 8.5 The marketing research department for the Stitch Clothing Company has determined that 22% of the items stocked account for 70% of the dollar sales. A typical outlet store carries 1000 items. The items accounting for the top 60% of sales are replenished from the company’s distribution center. The rest are shipped directly from the supplier (manufacturer) to the stores. How many items are represented by the top 60%? 8.6 Consider some process or procedure with which you are familiar that manifests some chronic problem. Develop a cause-and-effect diagram that identifies the possible causes of the problem. This is a project that lends itself to a team activity. 2

