Title
advertisement
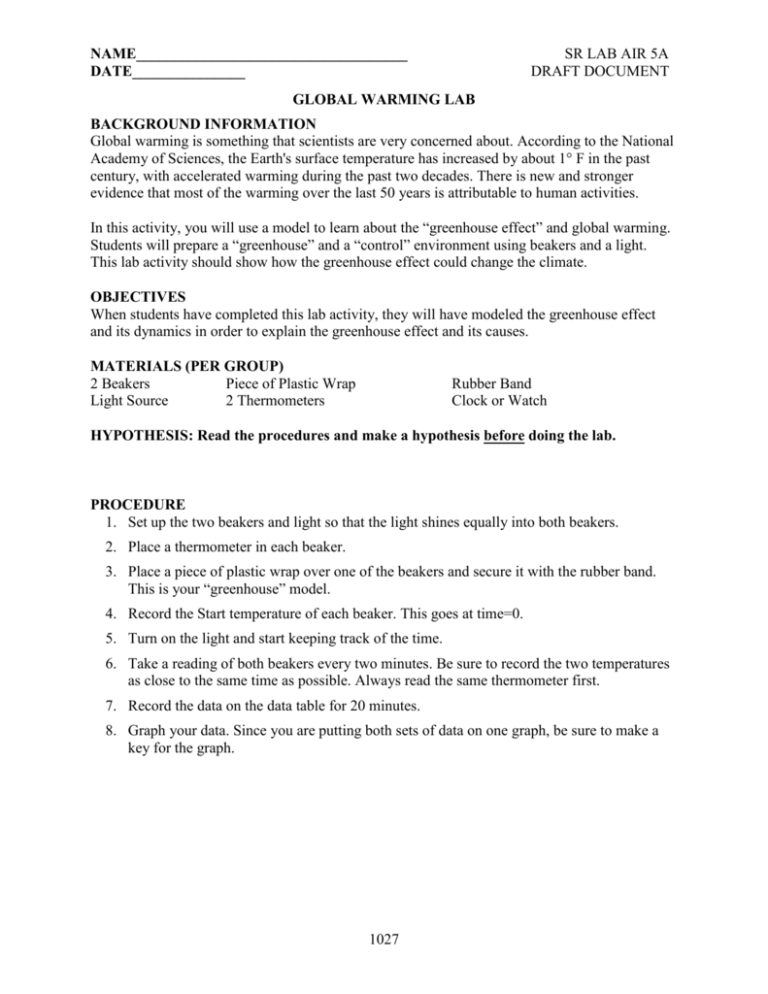
NAME____________________________________ DATE_______________ SR LAB AIR 5A DRAFT DOCUMENT GLOBAL WARMING LAB BACKGROUND INFORMATION Global warming is something that scientists are very concerned about. According to the National Academy of Sciences, the Earth's surface temperature has increased by about 1° F in the past century, with accelerated warming during the past two decades. There is new and stronger evidence that most of the warming over the last 50 years is attributable to human activities. In this activity, you will use a model to learn about the “greenhouse effect” and global warming. Students will prepare a “greenhouse” and a “control” environment using beakers and a light. This lab activity should show how the greenhouse effect could change the climate. OBJECTIVES When students have completed this lab activity, they will have modeled the greenhouse effect and its dynamics in order to explain the greenhouse effect and its causes. MATERIALS (PER GROUP) 2 Beakers Piece of Plastic Wrap Light Source 2 Thermometers Rubber Band Clock or Watch HYPOTHESIS: Read the procedures and make a hypothesis before doing the lab. PROCEDURE 1. Set up the two beakers and light so that the light shines equally into both beakers. 2. Place a thermometer in each beaker. 3. Place a piece of plastic wrap over one of the beakers and secure it with the rubber band. This is your “greenhouse” model. 4. Record the Start temperature of each beaker. This goes at time=0. 5. Turn on the light and start keeping track of the time. 6. Take a reading of both beakers every two minutes. Be sure to record the two temperatures as close to the same time as possible. Always read the same thermometer first. 7. Record the data on the data table for 20 minutes. 8. Graph your data. Since you are putting both sets of data on one graph, be sure to make a key for the graph. 1027 NAME____________________________________ DATE_______________ SR LAB AIR 5A DRAFT DOCUMENT DATA Use the table below to record the temperature of both thermometers every two minutes. Be careful to not shade the beakers as you get the data. LAB DATA TIME BEAKER #1 (Control) BEAKER #2 (Greenhouse) TIME BEAKER #1 (Control) BEAKER #2 (Greenhouse) 0 (START) °C °C 12 minutes °C °C 2 minutes °C °C 14 minutes °C °C 4 minutes °C °C 16 minutes °C °C 6 minutes °C °C 18 minutes °C °C 8 minutes °C °C 20 minutes °C °C 10 minutes °C °C ANALYSIS 1. What is the cause of global warming? 2. What effect can global warming have on the earth if it is not prevented? 3. Which beaker warmed up the most, the greenhouse model or the control? How does this result compare to your prediction? 4. Why do scientists sometimes use “models?” 5. What is the purpose of the control in the experiment? 6. Graph your results. Use different colors or line styles to represent each beaker. Include a key with your graph. 1028 NAME____________________________________ DATE_______________ SR LAB AIR 5A DRAFT DOCUMENT APPLICATION 1. Some scientists have insisted that humans are significantly increasing global warming. If they are correct, and we do not take steps to prevent it, what could be the consequences? 2. Some scientists insist that humans are not affecting global warming, but rather that the earth naturally goes through cycles that include warming and cooling trends. If they are correct and we do take steps to prevent global warming, what could be the consequences? 1029 NAME____________________________________ DATE_______________ 1030 SR LAB AIR 5A DRAFT DOCUMENT


