Answers
advertisement
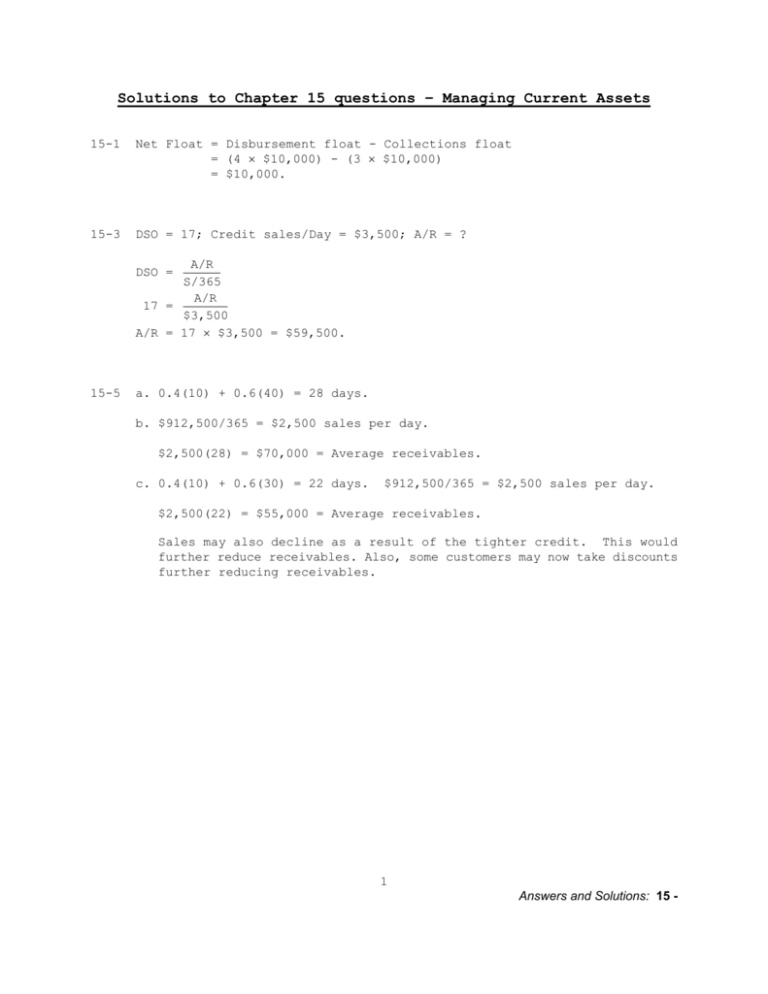
Solutions to Chapter 15 questions – Managing Current Assets 15-1 Net Float = Disbursement float - Collections float = (4 $10,000) - (3 $10,000) = $10,000. 15-3 DSO = 17; Credit sales/Day = $3,500; A/R = ? A/R S/365 A/R 17 = $3,500 A/R = 17 $3,500 = $59,500. DSO = 15-5 a. 0.4(10) + 0.6(40) = 28 days. b. $912,500/365 = $2,500 sales per day. $2,500(28) = $70,000 = Average receivables. c. 0.4(10) + 0.6(30) = 22 days. $912,500/365 = $2,500 sales per day. $2,500(22) = $55,000 = Average receivables. Sales may also decline as a result of the tighter credit. This would further reduce receivables. Also, some customers may now take discounts further reducing receivables. 1 Answers and Solutions: 15 - 15-10 a. Return on equity may be computed as follows: Tight Moderate Relaxed $ 900,000 1,000,000 $1,900,000 $1,000,000 1,000,000 $2,000,000 $1,200,000 1,000,000 $2,200,000 Debt (60% of assets) Equity Total liab./equity $1,140,000 760,000 $1,900,000 $1,200,000 800,000 $2,000,000 $1,320,000 880,000 $2,200,000 EBIT (12% $2 million) Interest (8%) Earnings before taxes Taxes (40%) Net income Return on equity $ $ $ Current assets (% of sales Sales) Fixed assets Total assets 240,000 91,200 $ 148,800 59,520 $ 89,280 11.75% 240,000 96,000 $ 144,000 57,600 $ 86,400 10.80% $ $ 240,000 105,600 134,400 53,760 80,640 9.16% b. No, this assumption would probably not be valid in a real world situation. A firm’s current asset policies, particularly with regard to accounts receivable, such as discounts, collection period, and collection policy, may have a significant effect on sales. The exact nature of this function may be difficult to quantify, however, and determining an “optimal” current asset level may not be possible in actuality. c. As the answers to Part a indicate, the tighter policy leads to a higher expected return. However, as the current asset level is decreased, presumably some of this reduction comes from accounts receivable. This can be accomplished only through higher discounts, a shorter collection period, and/or tougher collection policies. As outlined above, this would in turn have some effect on sales, possibly lowering profits. More restrictive receivable policies might involve some additional costs (collection, and so forth) but would also probably reduce bad debt expenses. Lower current assets would also imply lower liquid assets; thus, the firm’s ability to handle contingencies would be impaired. Higher risk of inadequate liquidity would increase the firm’s risk of insolvency and thus increase its chance of failing to meet fixed charges. Also, lower inventories might mean lost sales and/or expensive production stoppages. Attempting to attach numerical values to these potential losses and probabilities would be extremely difficult. 2 Answers and Solutions: 15 - 15-13 a. I. Helen’s Fashion Designs Cash Budget, July-December 2003 Collections and Payments: May $180,000 June $180,000 July $360,000 August $540,000 September October $720,000 $360,000 November $360,000 December January $ 90,000 $180,000 Collections: 1st month 18,000 2nd month 0 3rd month 0 Total collections 18,000 135,000 0 36,000 135,000 27,000 $198,000 54,000 270,000 27,000 $351,000 72,000 405,000 54,000 $531,000 36,000 540,000 81,000 $657,000 36,000 270,000 108,000 $414,000 9,000 270,000 54,000 $333,000 90,000 126,000 882,000 306,000 234,000 162,000 90,000 90,000 90,000 126,000 882,000 306,000 234,000 162,000 September October November December Sales Purchases 90,000 Payments (1-mo. lag) II. Gain or Loss for Month: July August Receipts: Collections $198,000 $351,000 $531,000 $657,000 $414,000 $333,000 Payments: Labor and raw materials Administrative salaries Lease payment Misc. expenses Income tax Progress payment Total payments 90,000 27,000 9,000 2,700 0 0 $128,700 126,000 27,000 9,000 2,700 0 0 $164,700 882,000 27,000 9,000 2,700 63,000 0 $983,700 306,000 27,000 9,000 2,700 0 180,000 $524,700 234,000 27,000 9,000 2,700 0 0 $272,700 162,000 27,000 9,000 2,700 63,000 0 $263,700 Net cash gain (loss) $ 69,300 $186,300 ($452,700) $132,300 $141,300 $ 69,300 September October November $387,600 ($ 65,100) $ 67,200 December $208,500 III. Cash Surplus or Loan Requirements: Cash at start of month w/o loans Cumulative cash Less: Target cash balance Cumulative surplus cash or total loans outstanding to maintain target balance July $132,000 August $201,300 201,300 90,000 387,600 90,000 $111,300 (65,100) 90,000 67,200 90,000 208,500 90,000 277,800 90,000 $297,600 ($155,100) ($22,800) $118,500 $187,800 b. The cash budget indicates that Helen will have surplus funds available during July, August, November, and December. During September the company will need to borrow $155,100. The cash surplus that accrues during October will enable Helen to reduce the loan balance outstanding to $22,800 by the end of October. c. In a situation such as this, where inflows and outflows are not synchronized during the month, it may not be possible to use a cash budget centered on the end of the month. The cash budget should be set up to show the cash positions of the firm on the 5th of each month. In this way the company could establish its maximum cash requirement and use these maximum figures to estimate its required line of credit. The table below shows the status of the cash account on selected dates within the month of July. It shows how the inflows accumulate steadily throughout the month and how the requirement of paying all the outflows on the 5th of the month requires that the firm obtain external financing. By July 14, however, the firm reaches the point where the inflows have offset the outflows, and by July 30 we see that the monthly totals agree with the cash budget developed earlier in Part a. 3 Answers and Solutions: 15 - Opening balance Cumulative inflows (1/30 receipts no. of days) Total cash available Outflow Net cash position Target cash balance 7/2/03 $132,000 7/4/03 $132,000 7/5/03 $132,000 7/6/03 $132,000 7/14/03 $132,000 7/30/03 $132,000 13,200 26,400 33,000 39,600 92,400 198,000 $145,200 $158,400 $165,000 $171,600 $224,400 $330,000 0 0 128,700 128,700 128,700 128,700 $145,200 $158,400 $ 36,300 $ 42,900 $ 95,700 $201,300 90,000 90,000 90,000 90,000 90,000 90,000 5,700 $111,300 Cash above minimum needs (borrowing needs) $ 55,200 $ 68,400 ($ 53,700)($ 47,100) $ d. The months preceding peak sales would show a decreased current ratio and an increased debt ratio due to additional short-term bank loans. In the following months as receipts are collected from sales, the current ratio would increase and the debt ratio would decline. Abnormal changes in these ratios would affect the firm’s ability to obtain bank credit. 4 Answers and Solutions: 15 - Integrated Case: 15 - 5


