AP Statistics - PatrickDooleyDHS
advertisement

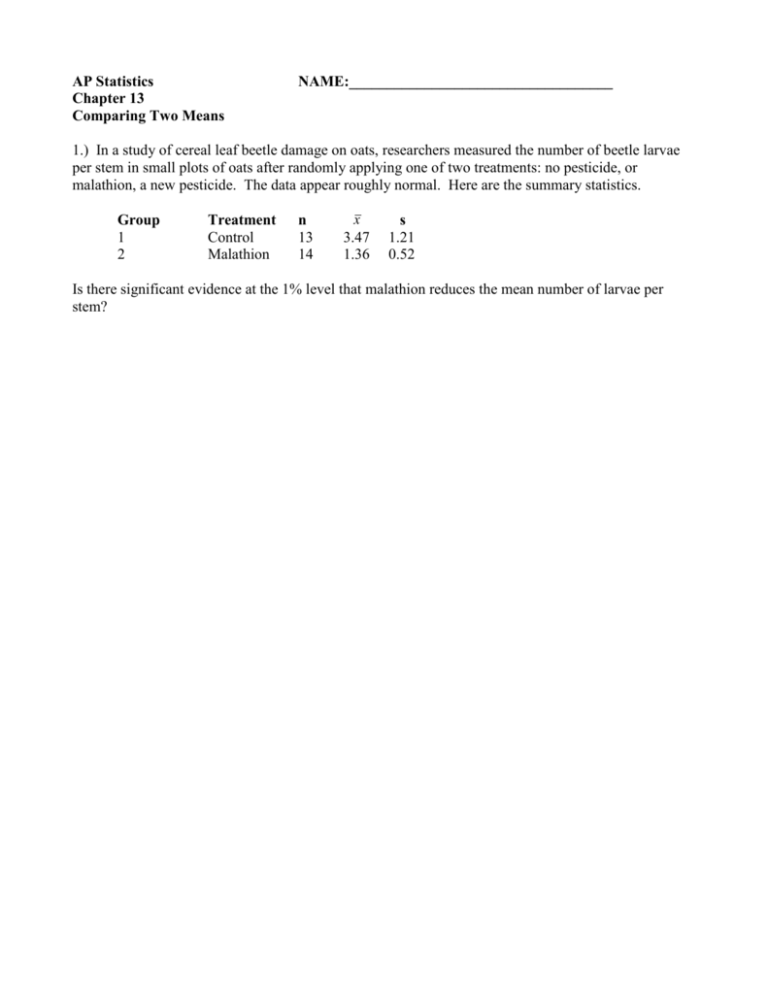
AP Statistics Chapter 13 Comparing Two Means NAME:___________________________________ 1.) In a study of cereal leaf beetle damage on oats, researchers measured the number of beetle larvae per stem in small plots of oats after randomly applying one of two treatments: no pesticide, or malathion, a new pesticide. The data appear roughly normal. Here are the summary statistics. Group 1 2 Treatment Control Malathion n 13 14 x 3.47 1.36 s 1.21 0.52 Is there significant evidence at the 1% level that malathion reduces the mean number of larvae per stem? 2.) The Effect of Logging How badly does logging damage tropical rainforests? One study compared forest plots in Borneo that had never been logged with similar plots nearby that had been logged 8 years earlier. The study found that the effects of logging were somewhat less severe than expected. Here are the data on the number of tree species in 12 unlogged plots and 9 logged plots: Unlogged Logged 22 17 18 4 22 18 20 14 15 18 21 15 13 15 13 10 19 12 13 19 15 Give a 90% confidence interval for the difference in mean number of species between unlogged and logged plots. 3.) Country A and Country B have been competing in the 200-meter dash in the Olympics for many years. A SRS of 200 meter running times for both countries is listed below: Country A Country B x 24.52 24.6 s 0.76 0.82 n 13 13 a.) Is there significant evidence to conclude that there is a difference between the average speed of the two groups? Give appropriate statistical justification. b.) Construct a 95% confidence interval for the difference between the average speeds of the two groups. Explain how this interval confirms or contradicts your conclusion in part a. 4.) Charles Darwin was interested in whether there was any difference in the heights of plants that were cross-fertilized or self fertilized. The data below shows the height in inches of plants grown in 15 pairs for a fixed period of time. One member of each pair was cross fertilized, and the other was selffertilized. Pair 1 2 3 4 5 6 7 8 9 10 11 12 13 14 15 Cross-fertilized 23.5 12.0 21.0 22.0 19.1 21.5 22.1 20.4 18.3 21.6 23.3 21.0 22.1 23.0 12.0 Self Fertilized 17.4 20.4 20.0 20.0 18.4 18.6 18.6 15.3 16.5 18.0 16.3 18.0 12.8 15.5 18.0 What conclusions could Darwin have drawn from this data? Justify your answer by using the proper inference test.


