Relative Rates of Growth - Economic and Political Weekly
advertisement
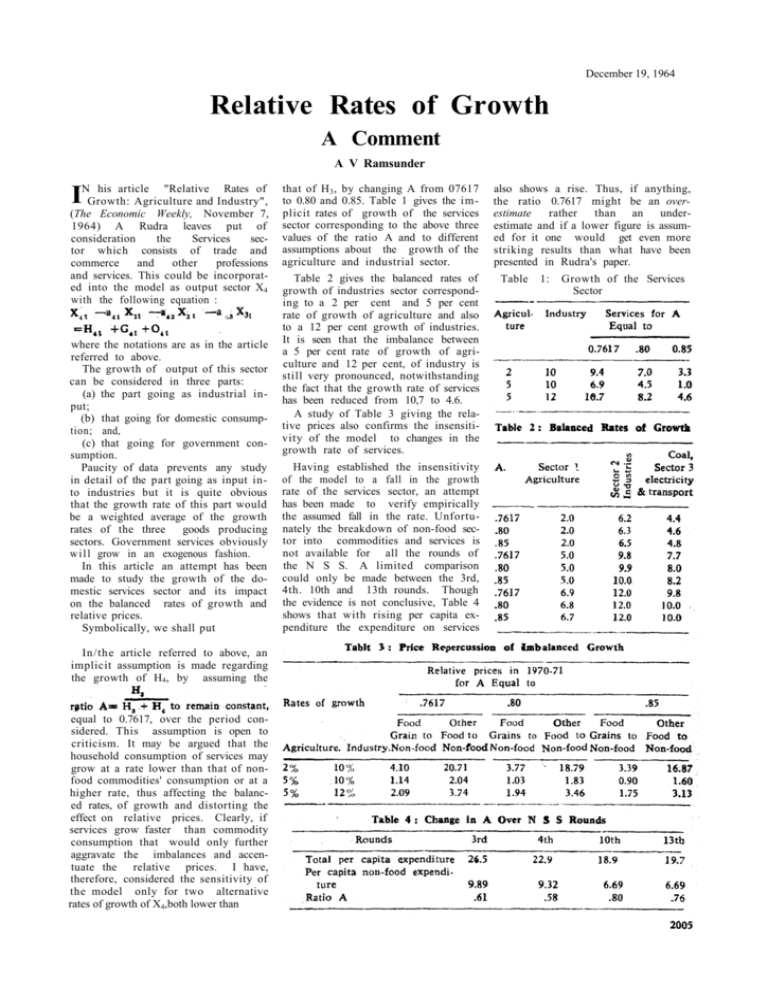
December 19, 1964 Relative Rates of Growth A Comment A V Ramsunder his article "Relative Rates of INGrowth: Agriculture and Industry", (The Economic Weekly, November 7, 1964) A Rudra leaves put of consideration the Services sector which consists of trade and commerce and other professions and services. This could be incorporated into the model as output sector X4 with the following equation : where the notations are as in the article referred to above. The growth of output of this sector can be considered in three parts: (a) the part going as industrial input; (b) that going for domestic consumption; and, (c) that going for government consumption. Paucity of data prevents any study in detail of the part going as input into industries but it is quite obvious that the growth rate of this part would be a weighted average of the growth rates of the three goods producing sectors. Government services obviously w i l l grow in an exogenous fashion. In this article an attempt has been made to study the growth of the domestic services sector and its impact on the balanced rates of growth and relative prices. Symbolically, we shall put In/the article referred to above, an implicit assumption is made regarding the growth of H4, by assuming the equal to 0.7617, over the period considered. This assumption is open to criticism. It may be argued that the household consumption of services may grow at a rate lower than that of nonfood commodities' consumption or at a higher rate, thus affecting the balanced rates, of growth and distorting the effect on relative prices. Clearly, if services grow faster than commodity consumption that would only further aggravate the imbalances and accentuate the relative prices. I have, therefore, considered the sensitivity of the model only for two alternative rates of growth of X4,both lower than that of H 3 , by changing A from 07617 to 0.80 and 0.85. Table 1 gives the implicit rates of growth of the services sector corresponding to the above three values of the ratio A and to different assumptions about the growth of the agriculture and industrial sector. Table 2 gives the balanced rates of growth of industries sector corresponding to a 2 per cent and 5 per cent rate of growth of agriculture and also to a 12 per cent growth of industries. It is seen that the imbalance between a 5 per cent rate of growth of agriculture and 12 per cent, of industry is still very pronounced, notwithstanding the fact that the growth rate of services has been reduced from 10,7 to 4.6. A study of Table 3 giving the relative prices also confirms the insensitivity of the model to changes in the growth rate of services. Having established the insensitivity of the model to a fall in the growth rate of the services sector, an attempt has been made to verify empirically the assumed fall in the rate. Unfortunately the breakdown of non-food sector into commodities and services is not available for all the rounds of the N S S. A limited comparison could only be made between the 3rd, 4th. 10th and 13th rounds. Though the evidence is not conclusive, Table 4 shows that with rising per capita expenditure the expenditure on services also shows a rise. Thus, if anything, the ratio 0.7617 might be an overestimate rather than an underestimate and if a lower figure is assumed for it one would get even more striking results than what have been presented in Rudra's paper. Table 1: Growth of the Services Sector


