Bubble Gum Lab
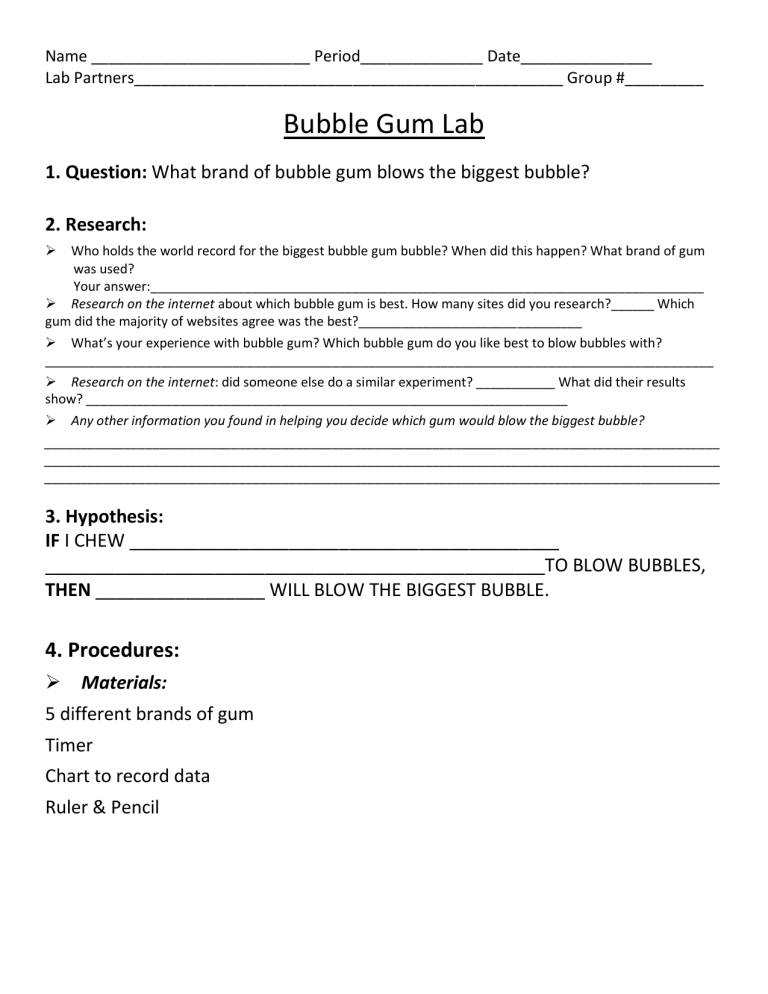
Name _________________________ Period______________ Date_______________
Lab Partners_________________________________________________ Group #_________
Bubble Gum Lab
1. Question: What brand of bubble gum blows the biggest bubble?
2. Research:
Who holds the world record for the biggest bubble gum bubble? When did this happen? What brand of gum was used?
Your answer:_____________________________________________________________________________
Research on the internet about which bubble gum is best. How many sites did you research?______ Which gum did the majority of websites agree was the best?_______________________________
What’s your experience with bubble gum? Which bubble gum do you like best to blow bubbles with?
_____________________________________________________________________________________________
Research on the internet : did someone else do a similar experiment? ___________ What did their results show? ___________________________________________________________________
Any other information you found in helping you decide which gum would blow the biggest bubble?
______________________________________________________________________________________________
______________________________________________________________________________________________
______________________________________________________________________________________________
3. Hypothesis:
IF I CHEW ___________________________________________
__________________________________________________TO BLOW BUBBLES,
THEN _________________ WILL BLOW THE BIGGEST BUBBLE.
4. Procedures:
Materials:
5 different brands of gum
Timer
Chart to record data
Ruler & Pencil
Procedures:
1 st
– Gather all materials
2 nd
– Prepare Chart to record data
3 rd
- Prepare timer for how long each piece of gum is chewed.
4 th
– Prepare piece of gum for chewing
5 th
- Prepare ruler for measuring bubble
6 th
– Have Gum Chewer #1 begin chewing gum
7 th
– Time for _____ seconds.
8 th
- Blow biggest bubble possible.
9 th
– Measure Bubble and document in chart
10 th
– Do steps 6 – 9 for Gum Chewer #2 – #6 for same brand.
11 th
– Repeat steps 6 – 9 for next brand of gum.
12 th
– After all gum has been chewed, measured, and documented, clean up area and begin analyzing your data.
5. Experiment
Perform the experiment = test all _____ brands of bubble gum to see which brand blows the biggest bubble.
6. Observe and Record
Record data onto the chart. GC = Gum Chewer
Measure bubbles in centimeters only!!
Brand of Gum GC #1 GC #2 GC #3
1.
GC #4 Average
2.
3.
4.
5.
Analyze Data
Each lab member chooses a brand of gum that they are going to create two graphs for. If you do not create your graphs, then you will make it impossible for your group to complete the lab!! Record this information here:
Lab member name __________________ = _________________ (brand of gum)
Lab member name __________________ = _________________ (brand of gum)
Lab member name __________________ = _________________ (brand of gum)
Lab member name __________________ = _________________ (brand of gum)
You alone answer these questions AFTER you create the graphs, for YOUR two graphs below:
Does the Stem-and-Leaf Plot or the Box-and-Whisker Plot better display the data? ___________________________
Explain why you think so:_________________________________________________________________________
______________________________________________________________________________________________
______________________________________________________________________________________________
Did the groups produce similar sized bubbles for your brand of gum? How do you know?
______________________________________________________________________________________________
______________________________________________________________________________________________
Is all of the data consistent, that is, is there any group average that seems to stand out? Explain how you know and name which graph you used to answer this question:
______________________________________________________________________________________________
______________________________________________________________________________________________
Obtain the average for YOUR brand of gum from the other groups in the class. Record that data here:
Brand of
Gum
Group #1
Average
Group #2
Average
Group #3
Average
Group #4
Average
Group #5
Average
Group #8
Average
Group #6
Average
Group #7
Average
Create two graphs of the Averages Chart
Stem-and-Leaf Plot of _______________ (brand) Box-and-Whisker Plot of ____________ (brand)
The questions below will be answered in class together, once we are back in our groups. We will be comparing your graphs with the graphs your lab partners made.
As a group, you will cut out and paste together all of your Stem-and-Leaf Plots on poster paper.
Then, as a group, you will cut out and paste together all of your Box-and-Whisker Plots together on poster paper.
Then you will make a bar graph together on different poster paper (make sure you create ALL characteristics of a complete graph), but you will need to decide what data you plan to use in the bar graph . Should you bar graph the median of each brand? The average of the averages of each brand? The maximum of each brand?
The minimum of each brand? State your group’s choice, and then explain why your group thinks your choice is the best way to analyze the bubble gum data (you are allowed to have the same answer as other members of your group, or a different answer, but every person must have an answer written on their own paper):
______________________________________________________________________________________________
______________________________________________________________________________________________
______________________________________________________________________________________________
______________________________________________________________________________________________
7. Conclusion (every person needs to answer these questions on their own paper)
According to your bar graph, state if your hypothesis was proven correct or not and explain why or why not .
______________________________________________________________________________________________
______________________________________________________________________________________________
______________________________________________________________________________________________
Give possible ideas as to how you could change or improve your experiment.
______________________________________________________________________________________________
______________________________________________________________________________________________
______________________________________________________________________________________________
What other questions did you come up with as you were doing the experiment?
______________________________________________________________________________________________
______________________________________________________________________________________________
______________________________________________________________________________________________
4 Excellent
BUBBLE GUM LAB REPORT RUBRIC
3 Good 2 Fair 1 Poor 0 Missing
Problem,
Title,
Heading
Background
/Collect
Information
Hypothesis
Student has correct heading, title makes a statement, and problem is in the form of a testable question.
Research is thorough and appropriate; student reflects upon prior knowledge and records both qualitative and quantitative observations.
Hypothesis is stated in an
“If, then” statement clearly identifying the dependent and independent variables.
Experiment
(Procedure/
Materials and Tools)
Student uses tools and materials appropriately and responsibly. Student correctly follows every aspect of the procedure and supplements procedure with effective and inventive additions.
Title is appropriate.
Correct heading and adequate problem is present.
Research and prior knowledge are relevant.
Observations go beyond the obvious in detail.
Hypothesis predicts answer to problem, is one complete sentence, and has the problem embedded in the statement.
Student usually uses tools and materials appropriately and responsibly. Student follows critical aspects or procedure, but has difficulty responding effectively to problems.
Student lacks appropriate title, heading, and/or problem.
Research and/or prior knowledge is limited.
Observations of problem are obvious.
Hypothesis predicts answer to problem and is written in one complete sentence.
Student lacks title, heading, and/or problem.
No research or prior knowledge is given. Student lacks understanding of scientific observations.
Hypothesis does not predict answer to problem.
Student does not use all tools and materials appropriately or responsibly. Student correctly follows some aspects of procedure, but makes crucial mistakes or skips some important steps.
Student does not use materials and tools appropriately or responsibly.
Student does not correctly follow many aspects of the procedure.
Missing, or the work shown is unintelligible.
Missing, or the work shown is unintelligible.
Missing, or the work shown is unintelligible.
Missing, or the work shown is unintelligible.
Data
Data is complete and correct with all relevant units and labels included.
Student provides a level of detail and organization that goes above and beyond requirements.
Data is complete and there are very few errors.
Units and labels are included, relevant and mostly correct.
Analysis/
Conclusion
Analysis and conclusion are complete and supported by student’s data. Student provides a level of detail and depth that goes above and beyond requirements.
Analysis and conclusion are complete and supported by student’s data. Relevant data and observations are referenced where appropriate.
Data is incomplete or does not include sufficient details. Relevant units or labels may be missing.
Data is incorrect or missing entirely. Relevant units or labels are missing.
Analysis and conclusion are incomplete/not supported by sufficient details. Relevant data and observations are not referenced.
Analysis or conclusion are missing, or do not make sense given student’s data and observations.
Missing, or the work shown is unintelligible.
Missing, or the work shown is unintelligible.
Teamwork
Student works cooperatively with lab partners to complete the activity, emerging as someone who supports the ideas and suggestions of his/her peers.
Student is able to work cooperatively with lab partners to complete the activity, but may not be receptive to partners’ ideas.
Student simply follows directions of partner/partners and makes little effort to actively contribute.
Student is unable to work cooperatively with lab partners.
Requires intervention by teacher.
Missing, or the work shown is unintelligible.
Total Rubric Score_________ 28 x 100 =_______percent 2 = ________ total pts earned
