Light bulb and resistors II: current - University of Delaware Dept. of
advertisement
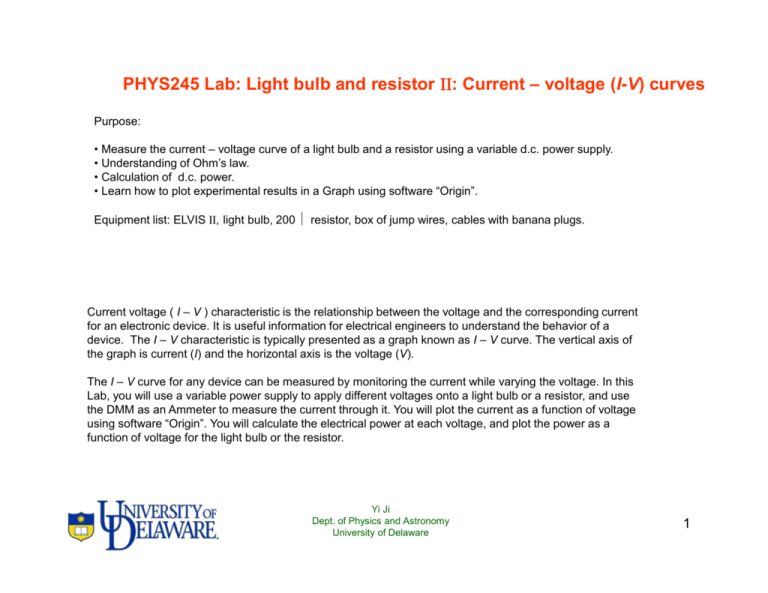
PHYS245 Lab: Light bulb and resistor ΙΙ: ΙΙ Current – voltage (I-V) curves Purpose: • Measure the current – voltage curve of a light bulb and a resistor using a variable d.c. power supply. • Understanding of Ohm’s law. • Calculation of d.c. power. • Learn how to plot experimental results in a Graph using software “Origin”. Equipment list: ELVIS ΙΙ, light bulb, 200 Ω resistor, box of jump wires, cables with banana plugs. Current voltage ( I – V ) characteristic is the relationship between the voltage and the corresponding current for an electronic device. It is useful information for electrical engineers to understand the behavior of a device. The I – V characteristic is typically presented as a graph known as I – V curve. The vertical axis of the graph is current (I) and the horizontal axis is the voltage (V). The I – V curve for any device can be measured by monitoring the current while varying the voltage. In this Lab, you will use a variable power supply to apply different voltages onto a light bulb or a resistor, and use the DMM as an Ammeter to measure the current through it. You will plot the current as a function of voltage using software “Origin”. You will calculate the electrical power at each voltage, and plot the power as a function of voltage for the light bulb or the resistor. Yi Ji Dept. of Physics and Astronomy University of Delaware 1 Pre-Lab Exercises Thoroughly read through this brochure and answer the following questions. • A current through a resistor produces heat, true or false? • If a current I is flowing through a resistor R. What is the heat generated in the resistor per unit time? • When a light bulb is glowing, the temperature of its filament is no more than 100 degree Celsius, true or false? • Use no more than 25 words to summarize why a light bulb’s resistance increases with increasing voltages. • If a resistor has a linear I – V curve, then there is no heating by the current, true or false? • The DMM can be used as a Voltmeter but not as a Ammeter, true or false? Yi Ji Dept. of Physics and Astronomy University of Delaware 2 Experiment Ι: Measure the I – V curve of a light bulb Introduction to the variable power supply (VPS) On your computer, click the “DMM” and “VPS” icons on the NI ELVISmx instrument launcher. You have used DMM before. Refer to the document for the previous lab if you are still not familiar with DMM. In this experiment, you will use it as an d.c. Ammeter. “VPS” is a variable power supply. There are two control knobs on the VPS window. These knobs are used to control the positive output and the negative output voltages of the VPS. To activate the voltage, try the following steps. • Dial the knob to reach the desired voltage, or type the voltage value directly into the text box underneath the control knob. • Turn on the power switch to the prototyping board. • Hit the “Run” button at the bottom of the VPS window. Please make sure that you finish the circuit on the board first before you turn on the power switch to the prototyping board. Always turn off the power switch to the prototyping board before you disassemble your circuit. There is a “sweep” function for the VPS. This allows the VPS to sweep voltage between preset values with preset step intervals. To use this function, choose between “+” or “-” power, type in start and end voltage, and type in the interval. Then hit the “sweep” button at the bottom. Yi Ji Dept. of Physics and Astronomy University of Delaware 3 Connect the light bulb to power (VPS) and Ammeter (DMM) The connection to the VPS is on the distribution stripe. Row#48 is the “+”, row #49 is “ground”, and row #50 is “-”. The “+” terminal provide a positive voltage relative to the “ground”. The “-” terminal supplies a negative voltage relative to the “ground” First, connect the light bulb to “+” power supply and the ammeter according to the diagram below. Make sure the polarity of the Ammeter is correct. The picture below is an example circuit. But it is not the only way to make the right connection. VPS - + A Light bulb Once the connection is completed, type in 6V in the VPS control, and switch on the power. The light bulb should light up. The DMM should give a positive current reading. If the current is negative, you must have the polarities wrong. Example circuit on prototyping board Yi Ji Dept. of Physics and Astronomy University of Delaware 4 Now you are ready to measure the I – V curve of the light bulb. Change the voltage output of the VPS from 0 to 12 V with 1 V step size. Read the corresponding current from the DMM. Record both the voltage and the current in your notebook. This gives you the data for the positive branch of the I – V curve Switch to the negative output of the VPS to finish the negative branch of the curve. Simply switch the wire from the “supply +” terminal on the distribution stripe to the “supply –” terminal. Use the left knob or the text box below in the VPS window to control the negative output voltage. Change the voltage from 0 to – 12 V with 1 V step size. Measure the corresponding current from the DMM. Record the data in your notebook. Plot the I – V curve using software “origin” (or EXCEL) in the computer. As shown in the screen shot on the right, enter the voltage as one column, and the corresponding current as another column. Then go to Plot - Line+symbol to generate a I – V curve. Print this plot and include it in the Lab report. Yi Ji Dept. of Physics and Astronomy University of Delaware 5 Learn more about light bulbs Ohm’s law is expressed as I= V R The current is proportional to the voltage, and inverse proportional to the resistance For a fixed resistance, the I – V curve should be a straight line, and the slope of the line is 1/R. The filament in the light bulb is a thin metal wire (tungsten) Most metals obey ohm’s law. So we should expect the I –V curve be a straight line. Now look at the I – V curve you made for the light bulb. Is it a straight line? As you can easily tell, the I – V curve of the bulb is not a straight line. Filament still obeys the Ohm’s law. But as the current (I) is increased, the filament is heated up by the current and the temperature increases. The heat produced per unit time is the power of the resistor: I2R or V2/R. The resistance (R) becomes higher as the temperature is increased. At sufficiently high temperature (2500 degree Celsius), the tungsten filament is so hot that it starts to glow. The air inside of the light bulb is evacuated and filled will inert gas such as Argon. This will avoid oxidation of the tungsten filament and increase its longevity. Use Ohm’s law to calculate the resistance at each voltage value. Then plot the R – V curve using Origin (or EXCEL). Verify that the resistance increases with increasing voltage. Calculate the electric power generated at each voltage value. Then plot the P – V curve using Origin or EXCEL. Include these graphs in your Lab report. Yi Ji Dept. of Physics and Astronomy University of Delaware 6 Experiment ΙΙ: ΙΙ Automatic voltage sweep In this experiment, you don’t have to measure anything. There is an automatic voltage sweep function in the VPS window. You can specify the source (supply + or supply -), the start voltage, stop voltage, step size, and step interval in the text boxes provided. Then click on the “sweep” button at the bottom of the window. Now sit back and enjoy the show. You can adjust these parameters to your liking. Experiment ΙΙΙ: ΙΙΙ Measure the I –V curve of a resistor Replace the light bulb with the 200 Ω resistor. Use the VPS and DMM to measure the I – V curve of the resistor. Plot the I –V, R – V, and P – V curves using Origin or EXCEL. Compare these results to the light bulb. Comment on whether the resistor obeys Ohm’s law. Yi Ji Dept. of Physics and Astronomy University of Delaware 7
