Lesson 2
advertisement

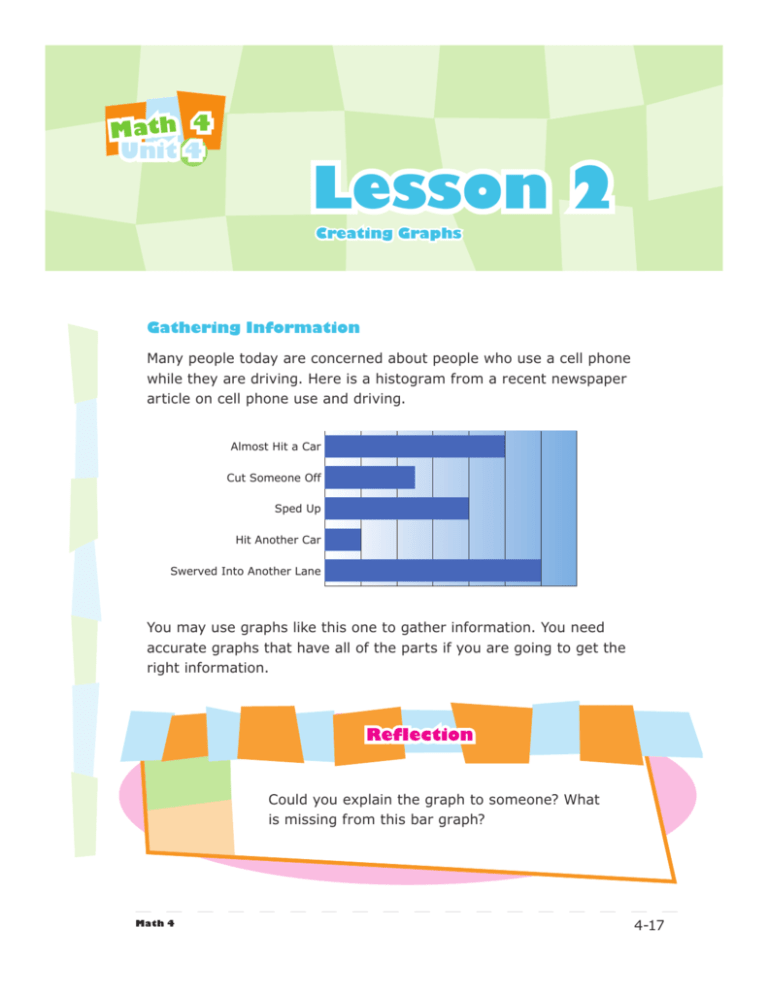
Math 4 Unit 4 Lesson 2 Creating Graphs Gathering Information Many people today are concerned about people who use a cell phone while they are driving. Here is a histogram from a recent newspaper article on cell phone use and driving. Almost Hit a Car Cut Someone Off Sped Up Hit Another Car Swerved Into Another Lane You may use graphs like this one to gather information. You need accurate graphs that have all of the parts if you are going to get the right information. Reflection Could you explain the graph to someone? What is missing from this bar graph? Math 4 4-17 Math 4 Unit 4 Lesson 2: Creating Graphs Objectives for this Lesson In this lesson you will explore the following concept: • Construction of bar graphs and pictographs for a set of data Let’s Explore Exploration 1: What’s In the Box? Materials: Unit 4, Lesson 2, Exploration 1 page from your Workbook, Pencil Alyssa’s mom put three toy boxes on the floor in front of the kids. She asked them to describe the contents of each box without looking. 4-18 Math 4 Unit 4 Lesson 2: Creating Graphs To give them a hint she made these pictographs: Toy Box 1 Toy Box 2 Toy Box 3 What is missing from these graphs? There are some missing parts to these graphs that would help you understand the symbols better. 1. What is missing from the pictographs? 2. What other information do you need? 3.Describe the contents you think are in Box 1. How did you get your answer? 4.Describe the contents you think are in Box 2. How did you get your answer? 5.Describe the contents you think are in Box 3. How did you get your answer? Math 4 4-19 Math 4 Unit 4 Lesson 2: Creating Graphs Constructing Pictographs To make a pictograph you will need to know the elements. Every pictograph should have a title. The title should give the reader the main idea of the meaning of the graph. Favourite School Lunch Items Title Example 1 A teacher surveyed her class. The survey question was: “What is your favourite item for lunch at school?” When she graphs the data, what can she use for the title of her graph? It is best to keep a title simple. You don’t want it to be too long. For this one don’t use the whole question: “What is your favourite item for lunch at school?” Narrow that down to what the question is about: “favourite school lunch item” or “favourite lunch” or “favourite school lunches” You can use any of these as a title. The title should be capitalized like this: Favourite School Lunch Items. 4-20 Math 4 Unit 4 Lesson 2: Creating Graphs Favourite School Lunch Items Another part of a pictograph is the symbols used for the graph. These are usually pictures. Sometimes they are simple shapes like circles or squares. Some possible symbols: You can use one symbol for all of the categories of the data. You can also use a different symbol for each category. Favourite School Lunch Items Field Trip Destinations Zoo Park Museum Lake A Symbol For Each Category Math 4 The Same Symbol For Each Category 4-21 Math 4 Unit 4 Lesson 2: Creating Graphs Once you have chosen a symbol for a pictograph you will need a legend. The legend will tell you the value of the symbol. Legend Favourite School Lunch Items Field Trip Destinations Each symbol = 3 children Zoo Legend Park = 5 people Museum Lake For the Favourite School Lunches pictograph, the symbols are different for each category so the legend says “each symbol” instead of drawing a picture of each. Legends should also show the size of each symbol. In these samples the size of each symbol is more than 1. What if there were 53 people surveyed with the field trip question? That would mean that 3 people would be left over. Some pictographs use half of a symbol: Movie Choice = 5 People = 4 People = 3 People = 2 People = 1 Person Comedy Drama Horror Action 4-22 By using parts of a symbol you can represent more numbers. Math 4 Unit 4 Lesson 2: Creating Graphs Pictographs also need a label for categories: Favourite School Lunch Items Each symbol = 3 children Categories Carrots String Apples Popcorn Cheese These are the survey question choices for this graph. They may also be items in a group. So remember, the parts of your pictograph: • title • symbols • legend • categories Math 4 4-23 Math 4 Unit 4 Lesson 2: Creating Graphs Let’s Explore Exploration 2: Create a Pictograph Materials: Unit 4, Lesson 2, Exploration 2 page from your Workbook, Pencil, Ruler, Pencil Crayons You are surveying the neighbourhood about starting a community service project. One of your questions is: Which group of people would you most like to help? (Choose one) a. hungry b. elderly c. homeless d. disabled You are going to create a pictograph of the results. Your results are in the table shown: 4-24 Group Number of Votes Hungry 45 Elderly 20 Homeless 75 Disabled 25 Math 4 Unit 4 Lesson 2: Creating Graphs 1. What would you use for a title? 2. What are your categories? 3. What will be your symbol or symbols? 4.What does each symbol represent? Be careful! Do you want each to represent 1 or more than 1? 5. Create your pictograph. Remember to include all parts of your graph. Example 2 Daksha created the pictograph for the data shown. Dessert Number of Votes Cookies 12 Cake 12 Fruit 8 Chocolate 16 Favourite Desserts Each symbol = 4 people What is missing from his pictograph that would make it easier to understand? Think about the parts of the pictograph: • Title: Daksha used an appropriate title for the data. • Symbol: He used symbols that represent each category. Math 4 4-25 Math 4 Unit 4 Lesson 2: Creating Graphs • Legend: The legend is in the pictograph and matches the data. • C ategories: The categories are missing. Without having them labelled the reader may think that the chocolates are just brown squares. Let’s Practice • In your Workbook go to Unit 4, Lesson 2 and complete 1 to 4. Constructing Bar Graphs Bar graphs should have most of the same parts as a pictograph. Instead of a legend, bar graphs will have a scale. The scale marks the length or height of the bars. This lets the reader find the value of each category. The parts of a bar graph: • Title • Scale marked on side or bottom • Categories • Bars Let’s Build a Bar Graph! Materials: Bar Graph Template from the back of this Unit in your Workbook, Pencil, Pencil Crayon 4-26 Math 4 Unit 4 Lesson 2: Creating Graphs Let’s make this one together! Use the bar graph template from your Workbook. You are surveying the neighbourhood about starting a community service project. One of your questions is: nteer s could you volu How many hour rvice a communit y se each month for e one) project? (Choos • a. 2 • b. 5 • c. 10 10 • d. more than The results of this question: Math 4 Hours Number of Votes 2 80 5 45 10 25 More than 10 15 4-27 Math 4 Unit 4 Lesson 2: Creating Graphs Select a Title: For this sample use “Volunteer Hours”. Put the title at the top of your graph. Volunteer Hours Label the categories: The categories will be the number of hours. Label them “2 hours”, “5 hours”, “10 hours” and “more than 10 hours”. 4-28 More than 10 Hours 10 Hours 5 Hours 2 Hours Volunteer Hours Math 4 Unit 4 Lesson 2: Creating Graphs Choose a scale: The numbers are really large. They can all be divided by 5, but even marking 5s will be hard since it goes to 80. You can use 10s. Half way between each mark will be 5. Scale of 10: 10, 20, 30, 40… Volunteer Hours 90 80 70 60 50 40 30 20 More than 10 Hours 10 Hours 5 Hours 2 Hours 10 Create the bars: The bars must be the appropriate height. Use your scale to line them up: Volunteer Hours 90 80 70 You have built 60 a bar graph! 50 40 30 20 Math 4 More than 10 Hours 10 Hours 5 Hours 2 Hours 10 4-29 Math 4 Unit 4 Lesson 2: Creating Graphs Let’s Explore Exploration 3: Creating a Bar Graph Materials: Unit 4, Lesson 2, Exploration 3 page from your Workbook, Pencil, Pencil Crayon Lian went on a camping trip with her family. The data table shows what she collected on her week long trip. Lian’s Collection Item Number Snails 15 Pine cones 60 Fireflies 45 Rocks 50 Create a bar graph for the data, using the template on your Workbook page. Remember to label all parts. Clearly label the scale. Let’s Practice • In your Workbook go to Unit 4, Lesson 2 and complete 5 to 8. Go online to complete the Concept Capsule about Creating Double Bar Graphs. 4-30


