The new world of Power - Rudolf Rechsteiner, Nationalrat, SP, Basel
advertisement
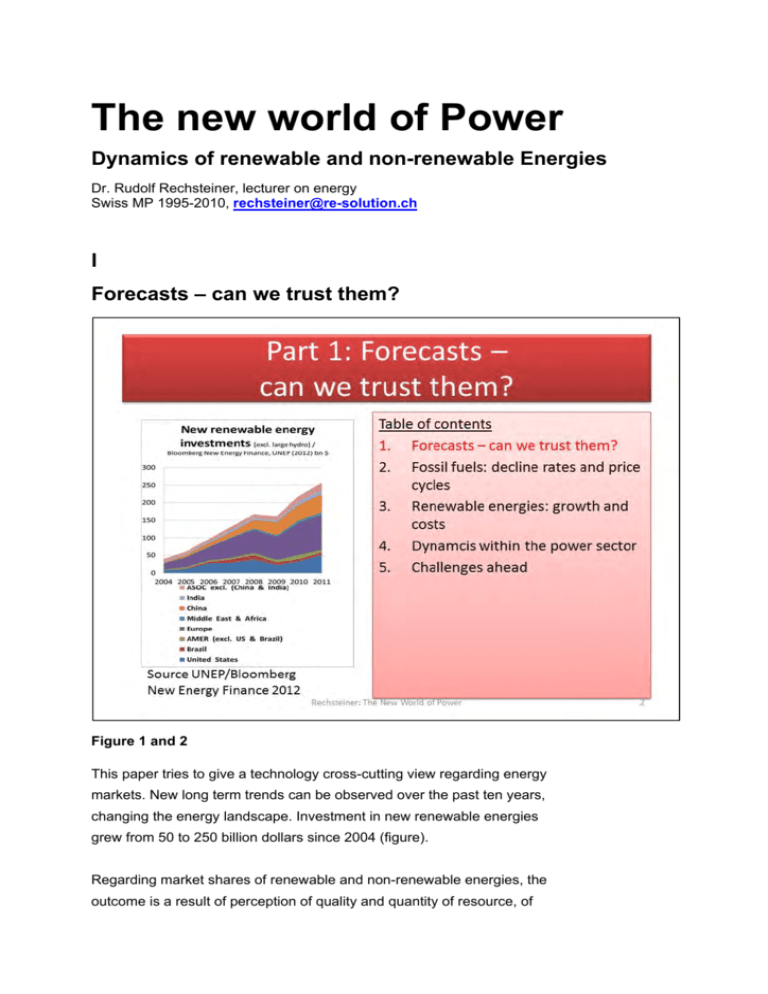
The new world of Power Dynamics of renewable and non-renewable Energies Dr. Rudolf Rechsteiner, lecturer on energy Swiss MP 1995-2010, rechsteiner@re-solution.ch I Forecasts – can we trust them? Figure 1 and 2 This paper tries to give a technology cross-cutting view regarding energy markets. New long term trends can be observed over the past ten years, changing the energy landscape. Investment in new renewable energies grew from 50 to 250 billion dollars since 2004 (figure). Regarding market shares of renewable and non-renewable energies, the outcome is a result of perception of quality and quantity of resource, of economics and of risks. Political frameworks need to be considered too. As we all know, there are externalities not reflected in the price of energy. Moreover the energy sector is highly subsidized by governments, including unpaid externalities. In this perspective, market shares tend to be a mirror of political programs, of industry lobbying and bribery too. Figure 3 When I was active in the Swiss Parliament we enjoyed a visit of Mr. William Ramsay, the International Energy Agency (IEA) deputy director. As an American official he was in the fossil industry before joining the IEA, and fossil were his views. He predicted unprecedented growth of fossil fuels and stagnation for everything else. He criticized the Swiss government for its energy policy –which barely existed – and denounced wind and solar as subsidized, expensive and elusive energies. Figure 4 As we can see, the accuracy of IEA projections on renewable energy has been very poor. Wind power grew many times faster than predicted in the yearly World Energy Outlook by the IEA. The median fault was 400 percent.1 1 See: Rudolf Rechsteiner /Energy Watch Group: Wind Power in Context, 2008 Figure 5 The 2012 UNEP Report on renewable energy2 shows how successful the renewable sector emerged. The core of this industry grew up in Europe after the Chernobyl nuclear disaster. It was China, an industrial heavyweight, who adopted these technologies after 2005 successfully to become a world leader in wind power installations and solar module production. And it is in the developing countries where growth of renewables shows the highest rates. 2 BLOOMBERG NEW ENERGY FINANCE: Global Trends in Renewable Energy Investments 2012, edited by UNEP Figure 6 The IEA perception for fossil fuels worked well in the nineties. The message was that cheap oil and gas will persist for many years. And that we should not care about energy when investing in new infrastructure such as cars, highways or airports. Figure 7 In 2002 the World Energy Outlook of the IEA said: "Crude oil prices are assumed to remain flat until 2010 at around $21 per barrel (in year 2000 dollars) – their average level for the past 15 years. They will then rise steadily to $29 in 2030.” As we all know today with oil at 100 US-$ per barrel, the reality is different. Figure 8 These fault estimates did not evolve as a surprise, considering the IEA method of prediction. The oil supply projections of this Outlook are derived from aggregated projections of oil demand…. Opec conventional oil production is assumed to fill the gap,“ the IEA wrote in 2002. Figure 9 After 2003 the IEA had to adapt its oil price forecasts to reality. The IEA behaved like a weather forecaster, hoping to be 60 percent right by saying the weather tomorrow will be the same as today, which did not work well for oil prices, however. II Fossil fuels and decline rates Figure 10 So let us go to the roots of errors in our next part. In 2008 the oil price had surged to 147 $ per barrel. The trust in cheap oil and into IEA predictions had waned. The time was mature to talk about oil decline rates. Figure 11 The peak oil discussion, initiated by Colin Campbell and Jean Laherrère in their famous Scientifi American contribution3 and of Aspo – the association for Study of Peak Oil and Gas – gained widespread influence. The IEA World Energy Outlook in November 2008 reported intensely on decline rates. It applied well-established petroleum engineering principles to 800 post-peak fields that make up the majority of global oil supplies. The natural decline rates of these fields were reported to average 3.4% for 54 supergiant fields, 6.5% for scores of giant fields and 10.4% decline rate for hundreds of large fields. At the IEA’s 6.7% level of capacity declines, the current 74 million b/d of conventional oil supplies4 would require 5 million b/d of supplemental new capacity annually just to maintain a flat level of supply. The IEA 2006 prediction of 120 mbd of oil by 2030 was abandoned. 3 4 The end of cheap oil, Sci.Am. 1999 excluding NGLs, biofuels, non-conventional oil and various other liquids) Figure 12 In saying so the IEA exactly adopted the Aspo view on oil decline – their decline rates were identical – identified at 5.5% for giant fields bei Höök and Aleklett. We should be aware what that means. 5 mbd of new production each year, that is one new Saudi Arabia in terms of new oil every two years. Figure 13 There is much hope to find this amount of new oil in the long run, but no evidence. Following an elaborated model of the IMF, oil prices persist at 100 $ per barrel or more and will rise toward 150 Dollar by 2020.5 There is no spare capacity in the market that is not consumed within few years. 5 Jaromir Benes et al. The Future of Oil: Geology versus Technology, Figure 14 Many nations started to develop unconventional resources such as oil sands, shale gas and biofuels from food crops. Biofuels and global warming drive up the price for foods with more people in poor countries starving. In this way, non-renewable energy starts to create new problems and conflicts. It causes food crisis and serious climate damage around the globe. Figure 15 There is strong evidence in many important oil territories that after peak oil, lost production cannot be replaced by conventional or unconventional resources, nor by natural gas. Figure 16 The marginal cost of oil production is reported to have increased by 9% year-over-year since 2002. Drilling companies are consuming more and more of the national revenue, a treadmill burden that creates no real new wealth.6 6 http://ftalphaville.ft.com/blog/2012/05/02/983171/marginal-oil-production-costs-are-heading-towards-100barrel/ Figure 17 There are some short term winners in the non-renewable sector out of this. Unconventional energies such as unconventional oil and shale gas have emerged. It is a boom – sponsored by high future prices – that led to a natural gas glut with natural gas prices significantly cheaper than oil in the US. Figure 18 However, how sustainable are these new resources? Oil and gas companies complain about the high cost of drilling – Exxons Rex Tillerson telling us that “all is in the red”.7 investors are “locked in” – suffering high expenses due to the need for continuous drilling to compensate for high decline rates. It means that the cost of these products is on the rise soon. 7 Exxon: 'Losing Our Shirts' on Natural Gas - WSJ.com <http://online.wsj.com/article/SB10001424052702303561504577492501026260464.html?mod=wsjde_finanzen_wsj_barro n_tickers> Figure 19 We should remember that unconventional resources are called unconventional because the effort to bring this energy to the market is higher than for conventional sources. The decline rates for natural gas shales and unconventional oil in the US are 20 to 30 percent a year, or more. Figure 20 Therefore this boom might not persist for a very long time. The unconventional plays show characteristics of a gold rush boom and bust. After a while decline rates will dominate the overall expansion, costs will rise and the interest in such plays might disappear. Figure 21 An overall price rise worldwide for fossil products is visible, hurting consumers worldwide. Rising prices for coal, natural gas and oil are an indicator that former cheap resources get scarce due to overall decline rates, higher costs, longer transports, more pollution and clean-up cost, despite industry pretending the opposite. Figure 22 More and more energy is needed to produce energy, and this comes at a cost. At a certain point an energy resource starts to be uninteresting. At one point net energy starts to get negative because investment cost turns out higher than energy return and alternatives turn out to be cheaper. Figure 23 This situation has arrived in the past in some countries. The Stone Age did not end because of a scarcity of stones. And industrialized nations reduced coal production not because of a scarcity of coal, but because something different and more valuable had emerged. III Renewable energy growth Figure 24 The new player in the game is renewable energy of many kind. The figure shows the emergence of solar PV. It grew by more than a 50% compound annual growth rate (CAGR) over the last decade. Figure 25 As we can see in this graph, this came along with a decline of new installations of nuclear plants which started to decline around 1986, after Chernobyl. Wind and solar installations grew at record growth rates since 1990 due to innovation and new market structures. Figure 26 Market share of nuclear energy fell from 19 percent to 12 percent of global electricity consumption and nuclear power generation had its historical peak in 2006. The nuclear industry is confronted with cost overruns, additional security costs, unresolved radioactive waste issues and protests. Figure 27 For nuclear energy a negative learning curve has been observed by various analysts – and the trend continues with the much hailed European Pressurized Reactor EPR of Areva who showed cost overruns of some 100 percent, covered by the French tax payers.8 8 Le Monde 31.August 2011 Figure 28 The learning curve of renewable energy goes definitely the other way round and shows a virtuous circle. Photovoltaics, wind power and other renewable energies offer a cost reduction over time rather than an increase. Each of the latter can fulfill all power needs worldwide. Figure 29 In 2011 renewables covered 43.6 percent of all new capacity additions. Adjusted for reduced full load hours, the additional energy was 31percent of all electric power additions, says UNEP. The overall contribution of renewables still is rather low, however, due to the huge old capacity built over past decades. Figure 30 It would be wrong to reduce the success of renewables to the factor of cost only. Behind this success story there is a trend for energy security and energy independence, new jobs, localized generation, short construction periods, local income and continuous technical innovation. For wind power, 16 different factors can be identified: 1. The primary energy is cost-free ; 2. The primary energy never runs out; 3. There is an abundant resource creating power independence in many regions of the world; 4. Stable life-cycle-cost can be guaranteed; 5. Wind power is competitive with other new power sources; 6. wind turbines cause no carbon, air emissions nor hazardous waste; 7. No water for cooling is needed; 8. Wind has an energy payback of less than 1 year; 9. There is global, easy access to wind technology; 10. Time to market is very short; 11. Fast innovation cycles prevail; 12. Wind is a young technology, allowing progress on the learning curve and cost reductions; 13. Wind is decentralized power with a non-exclusive structure; it allows small organizations or groups in various places to become a part of the power generation business and to sell it for a profit – very different from the exclusive structure of the oil, gas or nuclear business 14. Distance to consumers is moderate (1-1000 miles); 15. Wind has positive side benefits such as taxes, income for farmers, and remote areas; 16. Wind energy creates know-how and human labor. Many of these apply to solar as well. An additional advantage of solar is the relief of decentralized generation in times of congested grids. IV Dynamics within the power sector Figure 31 Now the renewables market shar starts to bite the conventional sector. The overall market share of renewables – including large hydro – will rise from 15 percent today to 25 percent in 2018, says the Mid-Term Renewable Energy Market Report of the International Energy Agency. Figure 32 The falling cost of renewable energies has tough implications for conventional energies. Due to its low variable cost and fuel cost of zero, wind and solar are the preferred power sources on the merit order of power plants. Wind and solar start to influence gross market prices. When the sun is shining, more expensive technologies are pushed out of the market and the latter have to reduce their capacity. This leads to higher costs in the conventional sector – running in shorter cycles and less full load hours. As can be seen on the German spot market: During day time with highest demand, spot prices begin to fall. Figure 33 Even in winter time solar and wind power combined lead to low prices during high demand. This price curve of March 7, 2012 shows day rates lower than night rates – something quite new in the world of power. Figure 34 On a sunny Sunday, gross market prices often stay below 3 Euro Cents all over during daytime. This is a benefit for all consumers, not just for consumers of wind and solar power. Figure 35 This figure displays the role of wind and solar in the German market over a typical week in May 2012. Some of the excess power is exported to neighboring countries and influencing their price structure too. Figure 36 Extrapolating this trend to 2020 it is expected that wind power and solar bite more and more into market shares of conventional energies. One conclusion of this is that traditional base load power from coal and nuclear does not fit into a world based on renewable energies. Flexible natural gas plants are doing better. V Challenges ahead Figure 37 Of course this secular change comprises some challenges; renewables need a different market structure and infrastructure. Figure 38 There are various possibilities for integration of renewable energies. Grid extensions and a change toward HVDC grids are promoted by the European Union. New grids and grid extensions have many benefits: balancing power generation with different technologies over different regions, access to new markets and access to power storage facilities such as pumped hydro in Scandinavia or in the Swiss mountains. Figure 39 There is a controversy on the question of cost of renewable energies. The German feed in tariffs (FITs) have been adopted by some 60 nations. They successfully led to a fast expansion and cost reduction. There is no doubt that Germany will come close to a 100% renewable energy in the power system by 2030 up from 3 percent in 1990 and 25 percent now. Figure 40 Wind power doubled its capacity every two to three years since 1995. This has reduced the cost of wind power significantly. Wind is on a par with new coal and natural gas, and minor price disruptions in the coal and gas market will accelerate its use. Figure 41 For solar the trend for cost reductions was even steeper. System cost fell by two third over the last five years. This opens many new markets in the future. Figure 42 In Europe and the US market shares of renewables have grown substantially over the last decade. Renewables start to have a decisive impact on electricity supply and the need for residual power plants is shrinking. Figure 43 Feed-in-Tariffs have reduced the costs of all kind of renewable installations, especially of solar photovoltaics. The German feed-intariffs for solar have been pushed down as low as 12 Eurocents by 2013, down from close to 60 Eurocents per kWh. The reduction of generation cost was possible due to a stable market framework. Figure 44 Here you can see the evolvement of the Swiss feed in tariffs for residential and open land solar power. A new competitive situation is emerging from this, with a lot of bashing against the new competitors. Feed in tariffs often are critized as a subsidy. But considered over a life cycle it is not. The price guaranteed is rate based, financed by consumers, not by taxes, the finance is self-reliant and polluter-oriented. In an open market, all renewable energies and nuclear start at a cost that is higher than market price, but due to the long life of renewable appliances, there is a return for the initial expense in the Golden End. In the open power market, no single power plant is cost effective against a market power price of some 5 to 7 €C./kWh, except maybe natural gas. But for natural gas a 60 percent cost share comes for the fuel and it would be unwise to bet on cheap gas only that may rise in price over time. For security of supply it is better to have a portfolio of different sources. Therefore we need a market structure that pays for these benefits and for the cleanliness of energy. Figure 45 With a life cycle cost approach, most renewable energies are cost effective today even at a higher initial price. Many Swiss hydro facilities produce at just 2 Cents per kWh, once depreciation of investment is paid for. The use of this infrastructure assets extend from 30 to 100 years beyond the pay-back-horizon of company finance, with crossgenerational benefits. Figure 46 Due to the reduction of cost, new markets are evolving without the FIT structure. Renewable distributed energy generation represents a growing part of the electric power industry, specially where electricity costs are high and large percentages of the population are without access to power. Peak shaving and decentralized load management are a seductive motive for utilities, too. Beyond feed-in-tariffs, PV will result as a least cost option. Figure 47 Nuclear power will eventually drop out of market due to high cost and unresolved risks. The compilation of feed in tariffs shows that the cost of new nuclear is higher than the cost of renewables. The nuclear industry asked David Cameron for a feed in tariff of more than 16 Pence per kWh. This is what The Times of London reported on July 15, 2012. Electricité de France (EDF) wants to be paid £165 per MWh (19.8 euros per MWh) for its proposed 3.2 GWe reactor and Hinkley C in Somerset, UK. The Times complained that the British consumers would be locked in for 25 years at a cost that goes much higher wind power onshore, wind power offshore and even solar.9 9 http://www.thetimes.co.uk/tto/business/industries/utilities/article3476326.ece Figure 48 We need new market frameworks including regulatory rules for sites with less prolific productivity, storage opportunities, rules for grid extensions as well as back-up power and a proper merit order management. The overall management might look as a complex affair. But once basic rules are defined it will work easily. A special focus should be put now on demand side innovation to bring renewables into more use. Cheaper renewables are a game changer. In the traffic sector, electric propulsion will emerge as a low cost option with cheaper batteries, thanks to much better efficiency of electric engines than internal combustion engines. Power to Gas can be used as an alternative for automotive use and it can be contribute to excess power management, and of course a valuable source for aviation. In the residential sector, heat pumps and heat storage can accommodate better self-supply. Solar thermal is a valuable source of energy for the housing sector, too Figure 49 Renewable energies use local resources which fluctuate along weather conditions. Their specific use and combination therefore has a regional face as you can see in these two options for Switzerland - pointing to a wind based or solar based 100% renewable delivery.10 10 Rudolf Rechsteiner: 100 Prozent erneuerbar, so gelingt der Umstieg auf saubere, erschwingliche Energien, Orell Füssli Verlag 2012 Figure 50 The challenges for a switch to renewables include A fair price for non-polluting power o Coverage of investment costs and risks over a facility’s life time o Integration of sites with high, medium and lower productivity, avoiding windfall profits o Long term stability of regulatory frameworks for cost reduction Access to the grids at non-discriminating prices o Preferential access to grids o Interconnection of different weather zones and technologies o Transparent grid codes Security of supply and backup management o Forecasting of demand and supply o combining storages such as biomass, hydro, batteries in a low cost way o Creation of intra-day and intra-hour markets for power exchange o Fair compensation of idle backup capacities o storing fossil fuels as “lenders of last resort” environmental care o minimizing environmental impacts while mobilizing natural resources by incentives and regional planning obligations o o Fair and sensitive planning of renewable energies and grids with a 100% approach in mind Protection for rare species, natural rivers, exceptional landscapes Figure 51 Renewable energies are a reliable, inexhaustible and virtually free primary energy, predictable but weather dependent. They can create a resilient system by decentralized, interconnected generation. They are becoming the backbone of an affordable energy system, in many places becoming a least costsolution. Renewables need a supportive market structure, open grids and large geographical interconnections with open access. Higher up-front costs are paid back by all kind of benefits including cheaper costs in the Golden End and virtually no pollution.
