M358K Final Exam Solutions, December 15, 2001 Part I. True or
advertisement
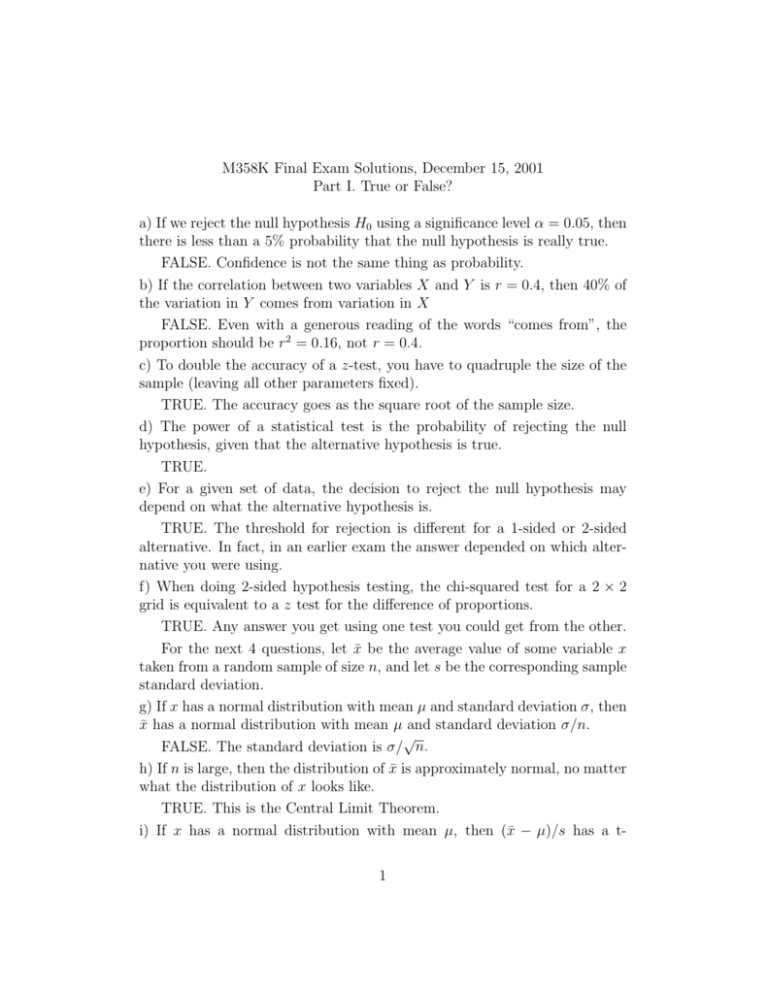
M358K Final Exam Solutions, December 15, 2001 Part I. True or False? a) If we reject the null hypothesis H0 using a significance level α = 0.05, then there is less than a 5% probability that the null hypothesis is really true. FALSE. Confidence is not the same thing as probability. b) If the correlation between two variables X and Y is r = 0.4, then 40% of the variation in Y comes from variation in X FALSE. Even with a generous reading of the words “comes from”, the proportion should be r2 = 0.16, not r = 0.4. c) To double the accuracy of a z-test, you have to quadruple the size of the sample (leaving all other parameters fixed). TRUE. The accuracy goes as the square root of the sample size. d) The power of a statistical test is the probability of rejecting the null hypothesis, given that the alternative hypothesis is true. TRUE. e) For a given set of data, the decision to reject the null hypothesis may depend on what the alternative hypothesis is. TRUE. The threshold for rejection is different for a 1-sided or 2-sided alternative. In fact, in an earlier exam the answer depended on which alternative you were using. f) When doing 2-sided hypothesis testing, the chi-squared test for a 2 × 2 grid is equivalent to a z test for the difference of proportions. TRUE. Any answer you get using one test you could get from the other. For the next 4 questions, let x̄ be the average value of some variable x taken from a random sample of size n, and let s be the corresponding sample standard deviation. g) If x has a normal distribution with mean µ and standard deviation σ, then x̄ has a normal distribution with mean µ and standard deviation σ/n. √ FALSE. The standard deviation is σ/ n. h) If n is large, then the distribution of x̄ is approximately normal, no matter what the distribution of x looks like. TRUE. This is the Central Limit Theorem. i) If x has a normal distribution with mean µ, then (x̄ − µ)/s has a t1 distribution with n − 1 degrees of freedom. √ FALSE. t = (x̄ − µ) n/s, not (x̄ − µ)/s. (This is the problem that I had intended to be true, but mistyped). j) If the distribution of x √ is skewed or has outliers, then the standard deviation of x̄ is NOT equal to σ/ n, where σ is the (population) standard deviation of x. √ FALSE. It is ALWAYS true that the standard deviation of x̄ is 1/ n times the standard deviation of x, regardless of the value of n or the distribution of x. This result is not the same as the Central Limit Theorem, which talks about the shape of the distribution of x̄, and which requires n to be large. k) When testing the difference of two means, the standard error for µ1 − µ2 is a weighted average of the standard error for µ1 and the standard error for µ2 . q FALSE. The standard error for µ1 − µ2 is SEµ21 + SEµ22 , which is larger than either SEµ1 or SEµ2 . l) In an SRS, every collection of k individuals has an equal change of being selected. TRUE. m) If there is a strong correlation between two variables, then one must affect the other. FALSE. Correlation is not causation. n) A statistical consulting firm does tests and constructs 95% confidence intervals for a large number of customers. Assuming they do their calculations correctly, their confidence intervals will contain the true value of the quantities they are measuring about 95% of the time. TRUE. 95% confidence means that the method works about 95% of the time, which is precisely what is stated. o) For a given standard of accuracy, sampling a large population requires more data than sampling a small population. FALSE. Accuracy depends on sample size, not population size. Part II. 1. z-tests versus t-tests. (5 points) Suppose we are comparing two populations (say, men vs. women at UT). We take a random sample of each population to compare attributes. When comparing the mean values of some 2 trait (e.g. weight) for the two populations, we use a t-statistic. However, when comparing the proportion of each population that has some trait (e.g., is registered to vote), we use a z-statistic. Explain why. Answer: A t statistic is used when you don’t know what the standard deviation σ is. However, when computing proportions you know the standard deviation in terms ofq p1 and p2 . Even though you don’t know p1 and p2 exactly, the formula p(1 − p) is not very sensitive to changes in p, and has an upper bound of q 0.5(1 − 0.5) = 1/2. 2. Life expectancy (5 points) The male members of my family, and of my wife’s family, have tended to die much younger than the female members. My father, my grandfathers, my wife’s father and my wife’s grandfathers died at the ages of 56, 70, 58, 65, 62, and 69. My mother, my grandmothers, and my wife’s grandmothers lived to be 83, 86, 81, 93, and 82, while my wife’s mother is still alive at 70. What statistically significant conclusions can we draw about my daughter’s life expectancy vs. my sons’? Answer: NONE! THE SAMPLE IS NOT RANDOM! Without a random sample, none of the statistical tests we learned about mean anything. This is probably the MOST important lesson for would-be statisticians. Anecdotal evidence, such as I gave you in this problem, should never be relied upon for statistical analysis. I am sad to report that the vast majority of the class got this problem wrong. 3. Shapes of distributions. a) The graph below shows two curves. On is the distribution of a quantity x in a large population. The other is the distribution of x̄ from random samples of size 10 taken from that population. Which is which? How can you tell? (You MUST justify your answer to get full credit). Answer: Curve 1 is the underlying distribution of x. That is, x is equally likely to be found anywhere between 1 and 6. The average value of 10 measurements, however, is bound to be fairly close to 3.5. It’s given by an approximatly √ normal distribution (curve 2), and has standard deviation a factor of 10 smaller than that of curve 1. b) On the same graph, sketch the distribution of the mean x̄ of random samples of size 40. Be as precise as possible. In particular, indicate what the 3 shape is supposed to be, and how the height and width of this curve compare to the others. Answer: This is a normalqdistribution with a standard deviation exactly half that of curve 2, since 40/10 = 2. In other words, it will be twice as high and half as wide as curve 2, and will still be centered at 3.5. 4. Vaccinations Measles vaccines are given to millions of American children every year. This prevents the million-or-more cases per year that used to occur before vaccination was started, but does lead to occasional side effects. In any given year, we should expect an average of 121 cases of severe complications from the vaccine. [These numbers are reasonably close to the truth, by the way]. a) What kind of probability distribution (e.g., uniform, exponential, binomial, poisson, normal, student t, chi squared, etc.) should describe the number of cases in a given year? What are the values of the relevant parameters for this distribution? Answer: This is a Poisson distribution with λ = 121. If you prefer, you can call it a binomial distribution with n =several million and p = 121/n. But that’s essentially the same as Poisson. b) What is the probability of getting 130 or fewer cases in a given year? √ Answer: Use the normal approximation. µ = λ = 121, σ = 121 = 11. z = (130.5 − 121)/11 = 0.864 (don’t forget the continuity correction!) and F (z) = F (0.864) = 0.806 = 8.06%. c) Suppose that, starting in 2002, a new vaccine will be used that is intended to be safer than the old vaccine. If there are 100 cases next year, can we conclude, with 95% confidence, that the new vaccine really is safer? [This question is purely hypothetical. To the best of my knowledge, there is no new vaccine.] Answer: Yes! The null hypothesis is that the two vaccines are equally safe (λ = 121), while the alternate hypothesis is that the new vaccine is safer (λ < 121). We compute using the null hypothesis: z = (100.5 − 121)/11 = −1.864, F (z) = 0.031. In other words, if the null hypothesis is true, then there is only a 3.1% chance of getting 100 or fewer cases. With 95% confidence, we reject the null hypothesis in favor of the alternative that the new vaccine is safer. 5. 2-way grid problem 4 A study was done of study habits of students in a large class, and the possible effect this has on grades. 28 students were tracked, of which some study with friends, some study with a tutor, and some study alone. All these students received either an A, B or C in the course, according to the following with friends with tutor alone A 5 2 2 table: B 3 4 2 C 3 1 6 a) Compute the expected number of counts, assuming that the two features are unrelated. Answer: The expected count for a square is the row total times the column total divided by the overall total (28). So our expected counts are: with friends with tutor alone A 3.54 2.25 3.21 B 3.54 2.25 3.21 C 3.93 2.5 3.57 b) Compute the chi-squared statistic. P (expected-actual)2 = 5.76. Answer: X 2 = expected c) How many degrees of freedom are there? Answer: df = (3 − 1)(3 − 1) = 4. d) Can we reject, with 90% confidence, the null hypothesis that one’s mode of study has nothing to do with what grade one gets? Answer: For 4 degrees of freedom and 90% confidence, the critical value of X 2 is 7.78. Since 5.76 < 7.78, we CANNOT reject the null hypothesis. 6. Cholesterol levels A study attemps to measure the difference in cholesterol levels between people in different countries. A random sample of 51 American men between the ages of 40 and 50 showed an average cholesterol count of x̄ = 197, with standard deviation s = 42. A random sample of 51 Japanese men between the ages of 40 and 50 showed an average cholesterol count of x̄ = 184, with standard deviation s = 37. a) Compute a 90% confidence interval for the true mean cholesterol level for American men aged 40–50. √ Answer: SE = 42/ 51 = 5.88, df = 50, so t∗ = 1.676, so µU SA = 197±9.86. 5 b) Compute a 95% confidence interval for the true mean cholesterol level for Japanese men aged 40–50. √ Answer: SE = 37/ 51 = 5.181, df=50, t∗ = 2.009, so µJapan = 184 ± 10.408. c) Compute a 99% confidence interval for the difference between the mean cholesterol levels in the USA and Japan (for men between 40-50). √ Answer: SE = 5.882 + 5.1812 = 7.84. Conservatively, we take df=50, so t∗ = 2.678. Thus µU SA − µJapan = 13 ± 20.99. 7. Proportions a) How much exit polling data do you need to predict the result of a referrendum to within 2% with 95% confidence? (You may assume that you have a random sample and that everybody you poll answers your questions truthfully). q √ Answer: .02 = z ∗ p(1 − p)/ n, so we need n = (z ∗ )2 p(1 − p)/(.02)2 . But p(1 − p) ≤ 1/4 and z ∗ = 1.96, so this works out to n = 2401. b) An exit survey of 1000 individuals shows that 542 voted in favor of the proposition and 458 voted against. With what degree of confidence can you say that the proposition passed? Answer: H0 is that the election is tied (p = 0.5). Ha is that the q proposition passes (p > 0.5). Note that this is a 1-sided alternative. σ = p(1 − p)/n = 0.0158. z = 0.042/0.0158 = 2.658. F (z) = 0.996, so we can reject H0 in favor of Ha with 99.6% confidence. In other words, we can say the proposition passed with 99.6% confidence. 8. Correlations You are given a sample of 18 data points (xi , yi) from a large population. Among these, you find that x̄ = 4.23, sx = 2.14, ȳ = 14.3, sy = 7.4, and r = 0.45. a) Find the equations of the best-fit regression line y = b0 + b1 x. Answer: b1 = rsy /sx = 1.556. b0 = ȳ − b1 x̄ = 7.717, so our best-fit line is y = 7.72 + 1.56x. b) What fraction of the variation in y is “explained” by the variation in x? Answer: r2 = .2025 = 20.25%. c) Can we conclude, with 95% confidence, that x and y are correlated? √ √ Answer: Do a t-test for the correlation. t = r n − 2/ 1 − r 2 = 0.45)(4)/0.893 = 6 2.0156. With n − 2 = 16 degrees of freedom, the critical value is t∗ = 2.120, so we CANNOT conclude, with 95% confidence that there is a correlation. (That’s assuming a 2-sided alternative. If you use a 1-sided alternative, then the critical value is only 1.746, and you CAN conclude that there’s a correlation). d) Construct a 90% confidence interval for the slope β1 of the best-fit line of the entire population. (You may assume that y can indeed be written as y = β0 + β1 x + , where is a normal random variable that is independent of x). qP (xi − x̄)2 . Answer: The key is finding the standard error, which equals s/ P P 2 2 2 2 However, (xi −x̄) = (n−1)sx = 77.85, and s = (yi −b0 −b1 xi ) /(n−2) = P (1−r2) (yi −ȳ)2 /(n−2) = (1−r2 )(n−1)s2y /(n−2) = 46.4. Thus SE = 0.772. Since t∗ = 1.746, we have β1 = 1.56 ± 1.348. 7

