Essentials of Business Statistics, 4th Edition
advertisement
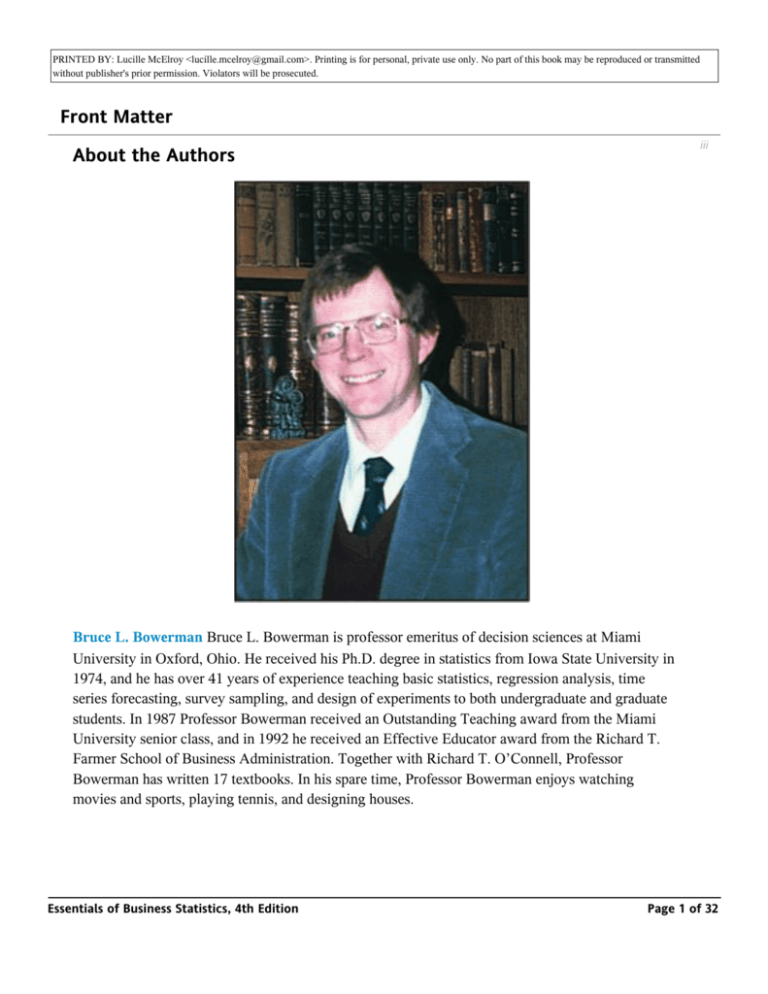
PRINTED BY: Lucille McElroy <lucille.mcelroy@gmail.com>. Printing is for personal, private use only. No part of this book may be reproduced or transmitted without publisher's prior permission. Violators will be prosecuted. Front Matter iii About the Authors Bruce L. Bowerman Bruce L. Bowerman is professor emeritus of decision sciences at Miami University in Oxford, Ohio. He received his Ph.D. degree in statistics from Iowa State University in 1974, and he has over 41 years of experience teaching basic statistics, regression analysis, time series forecasting, survey sampling, and design of experiments to both undergraduate and graduate students. In 1987 Professor Bowerman received an Outstanding Teaching award from the Miami University senior class, and in 1992 he received an Effective Educator award from the Richard T. Farmer School of Business Administration. Together with Richard T. O’Connell, Professor Bowerman has written 17 textbooks. In his spare time, Professor Bowerman enjoys watching movies and sports, playing tennis, and designing houses. Essentials of Business Statistics, 4th Edition Page 1 of 32 PRINTED BY: Lucille McElroy <lucille.mcelroy@gmail.com>. Printing is for personal, private use only. No part of this book may be reproduced or transmitted without publisher's prior permission. Violators will be prosecuted. movies and sports, playing tennis, and designing houses. Richard T. O’Connell Richard T. O’Connell is associate professor of decision sciences at Miami University in Oxford, Ohio. He has more than 36 years of experience teaching basic statistics, statistical quality control and process improvement, regression analysis, time series forecasting, and design of experiments to both undergraduate and graduate business students. He also has extensive consulting experience and has taught workshops dealing with statistical process control and process improvement for a variety of companies in the Midwest. In 2000 Professor O’Connell received an Effective Educator award from the Richard T. Farmer School of Business Administration. Together with Bruce L. Bowerman, he has written 17 textbooks. In his spare time, Professor O’Connell enjoys fishing, collecting 1950s and 1960s rock music, and following the Green Bay Packers and Purdue University sports. Essentials of Business Statistics, 4th Edition Page 2 of 32 PRINTED BY: Lucille McElroy <lucille.mcelroy@gmail.com>. Printing is for personal, private use only. No part of this book may be reproduced or transmitted without publisher's prior permission. Violators will be prosecuted. Emily S. Murphree Emily S. Murphree is Associate Professor of Statistics in the Department of Mathematics and Statistics at Miami University in Oxford, Ohio. She received her Ph.D. degree in statistics from the University of North Carolina and does research in applied probability. Professor Murphree received Miami’s College of Arts and Science Distinguished Educator Award in 1998. In 1996, she was named one of Oxford’s Citizens of the Year for her work with Habitat for Humanity and for organizing annual Sonia Kovalevsky Mathematical Sciences Days for area high school girls. Her enthusiasm for hiking in wilderness areas of the West motivated her current research on estimating animal population sizes. James Burdeane “Deane” Orris J. B. Orris is a professor of management science at Butler University in Indianapolis, Indiana. He received his Ph.D. from the University of Illinois in 1971, and in the late 1970s with the advent of personal computers, he combined his interest in statistics and computers to write one of the first personal computer statistics packages—MICROSTAT. Over the past 20 years, MICROSTAT has evolved into MegaStat which is an Excel add-in statistics program. He wrote an Excel book, Essentials: Excel 2000 Advanced, in 1999 and Basic Statistics Using Excel and MegaStat in 2006. He has taught statistics and computer courses in the College of Business Administration of Butler University since 1971. He is a member of the American Statistical Association and is past president of the Central Indiana Chapter. In his spare time, Essentials of Business Statistics, 4th Edition Page 3 of 32 PRINTED BY: Lucille McElroy <lucille.mcelroy@gmail.com>. Printing is for personal, private use only. No part of this book may be reproduced or transmitted without publisher's prior permission. Violators will be prosecuted. Business Administration of Butler University since 1971. He is a member of the American Statistical Association and is past president of the Central Indiana Chapter. In his spare time, Professor Orris enjoys reading, working out, and working in his woodworking shop. iii iv FROM THE AUTHORS In Essentials of Business Statistics, Fourth Edition, we provide a modern, practical, and unique framework for teaching the first course in business statistics. As in previous editions, this edition uses real or realistic examples, continuing case studies, and a business improvement theme to teach business statistics. Moreover, we believe this fourth edition features significantly simplified explanations, an improved topic flow, and a judicious use of the best, most interesting examples. We now discuss the attributes and new features that we think make this book an effective learning tool. Specifically, the book includes: • Continuing case studies that tie together different statistical topics. These continuing case studies span not only individual chapters but also groups of chapters. Students tell us that when new statistical topics are developed using familiar data from previous examples, their “fear factor” is reduced. Of course, to keep the examples from becoming tired and overused, we introduce new case studies throughout the book. • Business improvement conclusions that explicitly show how statistical results lead to practical business decisions. When appropriate, we conclude examples and case studies with a practical business improvement conclusion. To emphasize the text’s theme of business improvement, icons _ are placed in the page margins to identify when statistical analysis has led to an important business conclusion. Each conclusion is also highlighted in yellow for additional clarity. • New chapter introductions that list learning objectives and preview the case study analysis to be carried out in each chapter. • A shorter and more intuitive introduction to business statistics in Chapter 1. Chapter 1 introduces data (using a new home sales example that illustrates the value of data), discusses data sources, and gives an intuitive presentation of sampling. The technical discussion of how to select random and other types of samples has been moved to Chapter 7 (Sampling and Sampling Distributions), but the reader has the option of reading the sampling discussion in Chapter 7 immediately after completing Chapter 1. Essentials of Business Statistics, 4th Edition Page 4 of 32 PRINTED BY: Lucille McElroy <lucille.mcelroy@gmail.com>. Printing is for personal, private use only. No part of this book may be reproduced or transmitted without publisher's prior permission. Violators will be prosecuted. Chapter 7 immediately after completing Chapter 1. • A streamlined discussion of the graphical and numerical methods of descriptive statistics in Chapters 2 and 3. The streamlining has been accomplished by rewriting some explanations, using fewer examples, and focusing on the best, most interesting examples. • A simplified and improved discussion of probability and probability distributions. We have removed the somewhat complex AccuRatings case from Chapter 4 (Probability) and replaced it with some simpler examples, including the song rating case. We have also moved counting rules (formerly in an appendix) to an optional section in Chapter 4, and we have moved the hypergeometric distribution (formerly in an appendix) to an optional section in Chapter 5 (Discrete Random Variables). In addition, we have introduced continuous probability distributions using a more intuitive approach, and improved the explanation of the exponential distribution. • A simplified, unique, and more inferentially oriented approach to sampling distributions. In previous editions, we have introduced sampling distributions by using the game show and stock return cases. Although many reviewers liked this approach, others preferred the introduction to sampling distributions to be more oriented toward statistical inference. In this new edition, we begin with a unique and realistic example of estimating the mean mileage of a population of six preproduction cars. Because four of the six cars will be taken to auto shows and not be subjected to testing (which could harm their appearance), the true population mean mileage is not known and must be estimated by using a random sample of two cars that will not be taken to auto shows. Expanding from this small example, we generalize the discussion and show the sampling distribution of the sample mean when we select a random sample of five cars from the first year’s production of cars. The effect of sample size on the sampling distribution is then considered, as is the Central Limit Theorem. • A simpler discussion of confidence intervals employing a more graphical approach. We have completely rewritten and shortened the introduction to confidence intervals, using a simpler, more graphical approach. We have also added other new graphics throughout the chapter to help students more easily construct and interpret confidence intervals. iv v • A simpler and more streamlined discussion of hypothesis testing. This discussion includes an improved explanation of how to formulate null and alternative hypotheses, a shorter, fivestep hypothesis testing procedure, and greatly improved hypothesis testing summary boxes that feature innovative graphics showing students how to use critical values and p-values. • Simpler and improved discussions of comparing means, proportions, and variances. In Chapter 10 (Statistical Inferences Based on Two Samples) we only briefly mention the unrealistic variance-known approach to comparing two population means and move directly to the realistic variance-unknown case. We have also improved the discussion of comparing two population variances. In Chapter 11 (Experimental Design and Analysis of Variance) we Essentials of Business Statistics, 4th Edition Page 5 of 32 PRINTED BY: Lucille McElroy <lucille.mcelroy@gmail.com>. Printing is for personal, private use only. No part of this book may be reproduced or transmitted without publisher's prior permission. Violators will be prosecuted. to the realistic variance-unknown case. We have also improved the discussion of comparing two population variances. In Chapter 11 (Experimental Design and Analysis of Variance) we have simplified and clarified the discussions of the F-tests and multiple comparisons for oneway ANOVA and the randomized block design. We have also added a short section on twoway ANOVA. • A new and better flowing discussion of simple and multiple regression analysis. Previous editions intertwined two case studies through the basic discussion of simple regression and intertwined two case studies through the basic discussion of multiple regression. The book now employs a single new case, The Tasty Sub Shop Case, throughout the basic explanation of each technique. Based partly on how the real Quiznos restaurant chain suggests that business entrepreneurs evaluate potential sites for Quiznos restaurants, the Tasty Sub Shop case considers an entrepreneur who is evaluating potential sites for a Tasty Sub Shop restaurant. In the simple regression chapter, the entrepreneur predicts Tasty Sub Shop revenue by using population in the area. In the multiple regression and model building chapter, the entrepreneur predicts Tasty Sub Shop revenue by using population and business activity in the area. After the basic explanations of simple regression and multiple regression are completed, a further example illustrating each technique is presented. (The fuel consumption case of previous editions is now an exercise.) All discussions have been simplified and improved, and we have included a new short section on using squared and interaction variables, as well as slightly expanded discussions of model building and residual analysis in multiple regression. • Increased emphasis on Excel (and to some extent, MINITAB) throughout the text. Previous editions included approximately equal proportions of Excel, MINITAB, and MegaStat (an Excel add-in) outputs throughout the main text. Because three different types of output might seem overwhelming, we now include approximately equal proportions of Excel and MINITAB outputs throughout the main text. (MegaStat outputs appear in the main text only in advanced chapters where there is no viable way to use Excel.) There are now many more Excel outputs (which often replace the former MegaStat outputs) in the main text, and there are also more MINITAB outputs. The end-of-chapter appendices still show how to use all three software packages, and there are MegaStat outputs included in the end-of-chapter appendices that illustrate how to use MegaStat. Bruce L. Bowerman Richard T. O’Connell Emily S. Murphree J. B. Orris Essentials of Business Statistics, 4th Edition v Page 6 of 32 PRINTED BY: Lucille McElroy <lucille.mcelroy@gmail.com>. Printing is for personal, private use only. No part of this book may be reproduced or transmitted without publisher's prior permission. Violators will be prosecuted. J. B. Orris v vi A TOUR OF THIS TEXT’S FEATURES Chapter Introductions Each chapter begins with a list of the section topics that are covered in the chapter, along with chapter learning objectives and a preview of the case study analysis to be carried out in the chapter. Continuing Case Studies and Business Improvement Conclusions The main chapter discussions feature real or realistic examples, continuing case studies, and a business improvement theme. The continuing case studies span not only individual chapters but also groups of chapters and tie together different statistical topics. To emphasize the text’s theme of business improvement, icons are placed in the page margins to identify when statistical analysis has led to an important business improvement conclusion. Each conclusion is also highlighted in yellow for additional clarity. For example, in Chapters 1 and 3 we consider The Cell Phone Case: vi Essentials of Business Statistics, 4th Edition Page 7 of 32 PRINTED BY: Lucille McElroy <lucille.mcelroy@gmail.com>. Printing is for personal, private use only. No part of this book may be reproduced or transmitted without publisher's prior permission. Violators will be prosecuted. vi vii Figures and Tables Throughout the text, charts, graphs, tables, and Excel and MINITAB outputs are used to illustrate statistical concepts. For example: • In Chapter 3 (Descriptive Statistics: Numerical Methods), the following figures are used to help explain the Empirical Rule. Moreover, in The Car Mileage Case an automaker uses the Empirical Rule to find estimates of the “typical,” “lowest,” and “highest” mileage that a new midsize car should be expected to get in combined city and highway driving. In actual practice, real automakers provide similar information broken down into separate estimates for city and highway driving—see the Buick LaCrosse new car sticker in Figure 3.14. • In chapter 7 (Sampling and Sampling Distributions), the following figures (and others) are used to help explain the sampling distribution of the sample mean and the Central Limit Theorem. In addition, the figures describe different applications of random sampling in The Car Mileage Case, and thus this case is used as an integrative tool to help students understand sampling distributions. vii Essentials of Business Statistics, 4th Edition Page 8 of 32 PRINTED BY: Lucille McElroy <lucille.mcelroy@gmail.com>. Printing is for personal, private use only. No part of this book may be reproduced or transmitted without publisher's prior permission. Violators will be prosecuted. • In Chapter 8 (Confidence Intervals), the following figure (and others) are used to help explain the meaning of a 95 percent confidence interval for the population mean. Furthermore, in The Car Mileage Case an automaker uses a confidence interval procedure specified by the Environmental Protection Agency (EPA) to find the EPA estimate of a new midsize model’s true mean mileage. viii • In Chapter 9 (Hypothesis Testing), a five-step hypothesis testing procedure, new graphical hypothesis testing summary boxes, and many graphics are used to show how to carry out hypothesis tests. Essentials of Business Statistics, 4th Edition Page 9 of 32 PRINTED BY: Lucille McElroy <lucille.mcelroy@gmail.com>. Printing is for personal, private use only. No part of this book may be reproduced or transmitted without publisher's prior permission. Violators will be prosecuted. • In Chapters 13 and 14 (Simple Linear and Multiple Regression), a substantial number of data plots, Excel and MINITAB outputs, and other graphics are used to teach simple and multiple regression analysis. For example, in The Tasty Sub Shop Case a business entrepreneur uses data plotted in Figures 14.1 and 14.2 and the Excel and MINITAB outputs in Figure 14.4 to predict the yearly revenue of a potential Tasty Sub Shop restaurant site on the basis of the population and business activity near the site. Using the 95 percent prediction interval on the MINITAB output and projected restaurant operating costs, the entrepreneur decides whether to purchase a Tasty Sub Shop franchise for the potential restaurant site. viii ix Exercises Many of the exercises in the text use real data. Data sets are identified by an icon in the text and are included on the Online Learning Center (OLC): www.mhhe.com/bowermaness4e. Exercises in each section are broken into two parts—“Concepts” and “Methods and Applications”—and there are supplementary and Internet exercises at the end of each chapter. Essentials of Business Statistics, 4th Edition Page 10 of 32 PRINTED BY: Lucille McElroy <lucille.mcelroy@gmail.com>. Printing is for personal, private use only. No part of this book may be reproduced or transmitted without publisher's prior permission. Violators will be prosecuted. Chapter Ending Material and Excel/MINITAB/MegaStat® Tutorials The end-of-chapter material includes a chapter summary, a glossary of terms, important formula references, and comprehensive appendices that show students how to use Excel, MINITAB, and MegaStat. ix x WHAT TECHNOLOGY CONNECTS STUDENTS TO BUSINESS STATISTICS? _ McGraw-Hill Connect™ Business Statistics Less Managing. More Teaching. Greater Learning. McGraw-Hill Connect Business Statistics is an online assignment and assessment solution that connects students with the tools and resources they’ll need to achieve success. McGraw-Hill Connect Business Statistics helps prepare students for their future by enabling faster learning, more efficient studying, and higher retention of knowledge. Features. Connect Business Statistics offers a number of powerful tools and features to make managing assignments easier, so faculty can spend more time teaching. With Connect Business Statistics, students can engage with their coursework anytime and anywhere, making the learning process more accessible and efficient. Connect Business Statistics offers you the features described below. Essentials of Business Statistics, 4th Edition Page 11 of 32 PRINTED BY: Lucille McElroy <lucille.mcelroy@gmail.com>. Printing is for personal, private use only. No part of this book may be reproduced or transmitted without publisher's prior permission. Violators will be prosecuted. below. Simple Assignment Management. With Connect Business Statistics, creating assignments is easier than ever, so you can spend more time teaching and less time managing. The assignment management function enables you to: • Create and deliver assignments easily with selectable end-of-chapter questions and test bank items. • Streamline lesson planning, student progress reporting, and assignment grading to make classroom management more efficient than ever. • Go paperless with the eBook and online submission and grading of student assignments. Smart Grading. When it comes to studying, time is precious. Connect Business Statistics helps students learn more efficiently by providing feedback and practice material when they need it, where they need it. When it comes to teaching, your time also is precious. The grading function enables you to: • Have assignments scored automatically, giving students immediate feedback on their work and side-by-side comparisons with correct answers. Essentials of Business Statistics, 4th Edition Page 12 of 32 PRINTED BY: Lucille McElroy <lucille.mcelroy@gmail.com>. Printing is for personal, private use only. No part of this book may be reproduced or transmitted without publisher's prior permission. Violators will be prosecuted. work and side-by-side comparisons with correct answers. • Access and review each response; manually change grades or leave comments for students to review. • Reinforce classroom concepts with practice tests and instant quizzes. Integration of Excel Data Sets. A convenient feature is the inclusion of an Excel data file link in many problems using data sets in their calculation. This allows students to easily launch into Excel, work the problem, and return to Connect to key in the answer. Instructor Library. The Connect Business Statistics Instructor Library is your repository for additional resources to improve student engagement in and out of class. You can select and use any asset that enhances your lecture. The Connect Business Statistics Instructor Library includes: Essentials of Business Statistics, 4th Edition x xi Page 13 of 32 PRINTED BY: Lucille McElroy <lucille.mcelroy@gmail.com>. Printing is for personal, private use only. No part of this book may be reproduced or transmitted without publisher's prior permission. Violators will be prosecuted. • eBook • PowerPoint presentations • Test Bank • Solutions Manual • Digital Image Library Student Study Center. The Connect Business Statistics Student Study Center is the place for students to access additional resources. The Student Study Center: • Offers students quick access to lectures, practice materials, eBooks, and more. • Provides instant practice material and study questions, easily accessible on-the-go. Student Progress Tracking. Connect Business Statistics keeps instructors informed about how each student, section, and class is performing, allowing for more productive use of lecture and office hours. The progress-tracking function enables you to: • View scored work immediately and track individual or group performance with assignment and grade reports. • Access an instant view of student or class performance relative to learning objectives. • Collect data and generate reports required by many accreditation organizations, such as AACSB. xi Essentials of Business Statistics, 4th Edition Page 14 of 32 PRINTED BY: Lucille McElroy <lucille.mcelroy@gmail.com>. Printing is for personal, private use only. No part of this book may be reproduced or transmitted without publisher's prior permission. Violators will be prosecuted. xi xii _ McGraw-Hill Connect Plus Business Statistics. McGraw-Hill reinvents the textbook learning experience for the modern student with Connect Plus Business Statistics. A seamless integration of an eBook and Connect Business Statistics, Connect Plus Business Statistics provides all of the Connect Business Statistics features plus the following: • An integrated eBook, allowing for anytime, anywhere access to the textbook. • Dynamic links between the problems or questions you assign to your students and the location in the eBook where that problem or question is covered. • A powerful search function to pinpoint and connect key concepts in a snap. In short, Connect Business Statistics offers you and your students powerful tools and features that optimize your time and energy, enabling you to focus on course content, teaching, and student learning. Connect Business Statistics also offers a wealth of content resources for both instructors and students. This state-of-the-art, thoroughly tested system supports you in preparing students for the world that awaits. For more information about Connect, go to www.mcgrawhillconnect.com, or contact your local McGraw-Hill sales representative. Tegrity Campus: Lectures 24/7 _ Tegrity Campus is a service that makes class time available 24/7 by automatically capturing every lecture in a searchable format for students to review when they study and complete assignments. With a simple one-click start-and-stop process, you capture all computer screens and corresponding audio. Students can replay any part of any class with easy-to-use browser-based viewing on a PC or Mac. Educators know that the more students can see, hear, and experience class resources, the better they learn. In fact, studies prove it. With Tegrity Campus, students quickly recall key moments by using Tegrity Campus’s unique search feature. This search helps students efficiently find what they need, when they need it, across an entire semester of class recordings. Help turn all your students’ study time into learning moments immediately supported by your lecture. Essentials of Business Statistics, 4th Edition Page 15 of 32 PRINTED BY: Lucille McElroy <lucille.mcelroy@gmail.com>. Printing is for personal, private use only. No part of this book may be reproduced or transmitted without publisher's prior permission. Violators will be prosecuted. students’ study time into learning moments immediately supported by your lecture. To learn more about Tegrity, watch a 2-minute Flash demo at http://tegritycampus.mhhe.com. Assurance-of-Learning Ready Many educational institutions today are focused on the notion of assurance of learning, an important element of some accreditation standards. Essentials of Business Statistics is designed specifically to support your assurance-of-learning initiatives with a simple, yet powerful, solution. Each test bank question for Essentials of Business Statistics maps to a specific chapter learning outcome/objective listed in the text. You can use our test bank software, EZ Test and EZ Test Online, or Connect Business Statistics to easily query for learning outcomes/objectives that directly relate to the learning objectives for your course. You can then use the reporting features of EZ Test to aggregate student results in similar fashion, making the collection and presentation of assurance-of-learning data simple and easy. xii xiii AACSB Statement The McGraw-Hill Companies is a proud corporate member of AACSB International. Understanding the importance and value of AACSB accreditation, Essentials of Business Statistics recognizes the curricula guidelines detailed in the AACSB standards for business accreditation by connecting selected questions in the text and the test bank to the six general knowledge and skill guidelines in the AACSB standards. The statements contained in Essentials of Business Statistics are provided only as a guide for the users of this textbook. The AACSB leaves content coverage and assessment within the purview of individual schools, the mission of the school, and the faculty. While Essentials of Business Statistics and the teaching package make no claim of any specific AACSB qualification or evaluation, we have labeled within Essentials of Business Statistics selected questions according to the six general knowledge and skills areas. Essentials of Business Statistics, 4th Edition Page 16 of 32 PRINTED BY: Lucille McElroy <lucille.mcelroy@gmail.com>. Printing is for personal, private use only. No part of this book may be reproduced or transmitted without publisher's prior permission. Violators will be prosecuted. McGraw-Hill Customer Care Information At McGraw-Hill, we understand that getting the most from new technology can be challenging. That’s why our services don’t stop after you purchase our products. You can e-mail our Product Specialists 24 hours a day to get product-training online. Or you can search our knowledge bank of Frequently Asked Questions on our support website. For Customer Support, call 800-331-5094, e-mail hmsupport@mcgraw-hill.com, or visit www.mhhe.com/support. One of our Technical Support Analysts will be able to assist you in a timely fashion. xiii xiv WHAT RESOURCES ARE AVAILABLE FOR INSTRUCTORS _ ALEKS is an assessment and learning program that provides individualized instruction in Business Statistics, Business Math, and Accounting. Available online in partnership with McGraw-Hill/Irwin, ALEKS interacts with students much like a skilled human tutor, with the ability to assess precisely a student’s knowledge and provide instruction on the exact topics the student is most ready to learn. By providing topics to meet individual students’ needs, allowing students to move between explanation and practice, correcting and analyzing errors, and defining terms, ALEKS helps students to master course content quickly and easily. ALEKS also includes an Instructor Module with powerful, assignment-driven features and extensive content flexibility. ALEKS simplifies course management and allows instructors to spend less time with administrative tasks and more time directing student learning. To learn more about ALEKS, visit www.aleks.com/highered/business. ALEKS is a registered trademark of ALEKS Corporation. Essentials of Business Statistics, 4th Edition Page 17 of 32 PRINTED BY: Lucille McElroy <lucille.mcelroy@gmail.com>. Printing is for personal, private use only. No part of this book may be reproduced or transmitted without publisher's prior permission. Violators will be prosecuted. Online Learning Center: www.mhhe.com/bowermaness4e The Online Learning Center (OLC) is the text website with online content for both students and instructors. It provides the instructor with a complete Instructor’s Manual in Word format, the complete Test Bank in both Word files and computerized EZ Test format, Instructor PowerPoint slides, text art files, an introduction to ALEKS®, an introduction to McGraw-Hill Connect Business Statistics™, access to the eBook, and more. _ All test bank questions are available in an EZ Test electronic format. Included are a number of multiple-choice, true/false, and short-answer questions and problems. The answers to all questions are given, along with a rating of the level of difficulty, Bloom’s taxonomy question type, and AACSB knowledge category. Visual Statistics www.mhhe.com/bowermaness4e Visual Statistics 2.2 by Doane, Mathieson, and Tracy is a software program for teaching and learning statistics concepts. It is unique in that it allows students to learn the concepts through interactive experimentation and visualization. The software and worktext promote active learning through competency-building exercises, individual and team projects, and built-in databases. Over 400 data sets from business settings are included within the package as well as a worktext in electronic format. This software is available on the Online Learning Center (OLC) for Bowerman 4e. WebCT/Blackboard/eCollege All of the material in the Online Learning Center is also available in portable WebCT, Blackboard, or e-College content “cartridges” provided free to adopters of this text. xiv Essentials of Business Statistics, 4th Edition Page 18 of 32 PRINTED BY: Lucille McElroy <lucille.mcelroy@gmail.com>. Printing is for personal, private use only. No part of this book may be reproduced or transmitted without publisher's prior permission. Violators will be prosecuted. xiv xv WHAT RESOURCES ARE AVAILABLE FOR STUDENTS CourseSmart _ CourseSmart is a new way to find and buy eTextbooks. CourseSmart has the largest selection of eTextbooks available anywhere, offering thousands of the most commonly adopted textbooks from a wide variety of higher education publishers. CourseSmart eTextbooks are available in one standard online reader with full text search, notes and highlighting, and e-mail tools for sharing notes between classmates. Visit www.CourseSmart.com for more information on ordering. Online Learning Center: www.mhhe.com/bowermaness4e The Online Learning Center (OLC) provides students with the following content: • Quizzes • Data sets • PowerPoint *• PowerPoint (narrated) *• ScreenCam Tutorials *• Visual Statistics • Chapter 15 • Appendixes *Premium content Business Statistics Center (BSC): www.mhhe.com/bstat/ The BSC contains links to statistical publications and resources, software downloads, learning aids, statistical websites and databases, and McGraw-Hill/Irwin product websites and online courses. Essentials of Business Statistics, 4th Edition Page 19 of 32 PRINTED BY: Lucille McElroy <lucille.mcelroy@gmail.com>. Printing is for personal, private use only. No part of this book may be reproduced or transmitted without publisher's prior permission. Violators will be prosecuted. WHAT SOFTWARE IS AVAILABLE MegaStat® for Excel (ISBN: 0077395131) MegaStat is a full-featured Excel add-in by J. B. Orris of Butler University that is available with this text. It performs statistical analyses within an Excel workbook. It does basic functions such as descriptive statistics, frequency distributions, and probability calculations, as well as hypothesis testing, ANOVA, and regression. MegaStat output is carefully formatted. Ease-of-use features include Auto Expand for quick data selection and Auto Label detect. Since MegaStat is easy to use, students can focus on learning statistics without being distracted by the software. MegaStat is always available from Excel’s main menu. Selecting a menu item pops up a dialog box. MegaStat works with all recent versions of Excel, including Excel 2010. MINITAB®/SPSS®/JMP® Minitab® Student Version 14, SPSS® Student Version 18.0, and JMP 8 Student Edition are software tools that are available to help students solve the business statistics exercises in the text. Each is available in the student version and can be packaged with any McGraw-Hill business statistics text. xv xvi ACKNOWLEDGMENTS We wish to thank many people who have helped to make this book a reality. We thank Drena Bowerman, who spent many hours cutting and taping and making trips to the copy shop, so that we could complete the manuscript on time. As indicated on the title page, we thank Professor Steven C. Huchendorf, University of Minnesota; Dawn C. Porter, University of Southern California; and Patrick J. Schur, Miami University; for major contributions to this book. We also thank Susan Cramer of Miami University for helpful advice on writing this book. We also wish to thank the people at McGraw-Hill/Irwin for their dedication to this book. These people include executive editor Steve Schuetz, who is an extremely helpful resource to the authors; executive editor Dick Hercher, who persuaded us initially to publish with McGraw-Hill/Irwin and who continues to offer sound advice and support; senior developmental editor Wanda Zeman, who has shown great dedication to the improvement of this book; and lead project manager Harvey Yep, who has very capably and diligently guided this book through its production and who has been a tremendous help to the authors. We also thank our former executive editor, Scott Isenberg, for the tremendous help he has given us in developing all of our McGraw-Hill business statistics books. Essentials of Business Statistics, 4th Edition Page 20 of 32 PRINTED BY: Lucille McElroy <lucille.mcelroy@gmail.com>. Printing is for personal, private use only. No part of this book may be reproduced or transmitted without publisher's prior permission. Violators will be prosecuted. tremendous help he has given us in developing all of our McGraw-Hill business statistics books. Many reviewers have contributed to this book, and we are grateful to all of them. They include Lawrence Acker, Harris-Stowe State University Ajay K. Aggarwal, Millsaps College Mohammad Ahmadi, University of Tennessee–Chattanooga Sung K. Ahn, Washington State University Eugene Allevato, Woodbury University Mostafa S. Aminzadeh, Towson University Henry Ander, Arizona State University–Tempe Randy J. Anderson, California State University–Fresno Mohammad Bajwa, Northampton Community College Ron Barnes, University of Houston–Downtown John D. Barrett, University of North Alabama Mary Jo Boehms, Jackson State Community College Pamela A. Boger, Ohio University–Athens Dave Bregenzer, Utah State University Philip E. Burian, Colorado Technical University–Sioux Falls Giorgio Canarella, California State University–Los Angeles Essentials of Business Statistics, 4th Edition Page 21 of 32 PRINTED BY: Lucille McElroy <lucille.mcelroy@gmail.com>. Printing is for personal, private use only. No part of this book may be reproduced or transmitted without publisher's prior permission. Violators will be prosecuted. Giorgio Canarella, California State University–Los Angeles Margaret Capen, East Carolina University Priscilla Chaffe-Stengel, California State University–Fresno Ali A. Choudhry, Florida International University Richard Cleary, Bentley College Bruce Cooil, Vanderbilt University Sam Cousley, University of Mississippi Teresa A Dalton, University of Denver Nit Dasgupta, University of Wisconsin–Eau Claire Linda Dawson, University of Washington–Tacoma Jay Devore, California Polytechnic State University Joan Donohue, University of South Carolina Anne Drougas, Dominican University Mark Eakin, University of Texas–Arlington Hammou Elbarmi, Baruch College Soheila Fardanesh, Towson University Nicholas R. Farnum, California State University–Fullerton James Flynn, Cleveland State University Essentials of Business Statistics, 4th Edition Page 22 of 32 PRINTED BY: Lucille McElroy <lucille.mcelroy@gmail.com>. Printing is for personal, private use only. No part of this book may be reproduced or transmitted without publisher's prior permission. Violators will be prosecuted. James Flynn, Cleveland State University Lillian Fok, University of New Orleans Tom Fox, Cleveland State Community College Charles A. Gates Jr., Olivet Nazarene University Linda S. Ghent, Eastern Illinois University Allen Gibson, Seton Hall University Scott D. Gilbert, Southern Illinois University Nicholas Gorgievski, Nichols College TeWhan Hahn, University of Idaho Clifford B. Hawley, West Virginia University Rhonda L. Hensley, North Carolina A&T State University Eric Howington, Valdosta State University Zhimin Huang, Adelphi University C. Thomas Innis, University of Cincinnati Jeffrey Jarrett, University of Rhode Island Craig Johnson, Brighan Young University Nancy K. Keith, Missouri State University Thomas Kratzer, Malone University Essentials of Business Statistics, 4th Edition Page 23 of 32 PRINTED BY: Lucille McElroy <lucille.mcelroy@gmail.com>. Printing is for personal, private use only. No part of this book may be reproduced or transmitted without publisher's prior permission. Violators will be prosecuted. Thomas Kratzer, Malone University Alan Kreger, University of Maryland Michael Kulansky, University of Maryland Risa Kumazawa, Georgia Southern University David A. Larson, University of South Alabama John Lawrence, California State University–Fullerton Lee Lawton, University of St. Thomas John D. Levendis, Loyola University–New Orleans Barbara Libby, Walden University Carel Ligeon, Auburn University–Montgomery Kenneth Linna, Auburn University–Montgomery David W. Little, High Point University Donald MacRitchie, Framingham State College Edward Markowski, Old Dominion University Mamata Marme, Augustana College Jerrold H. May, University of Pittsburgh Brad McDonald, Northern Illinois University Richard A. McGowan, Boston College Essentials of Business Statistics, 4th Edition Page 24 of 32 PRINTED BY: Lucille McElroy <lucille.mcelroy@gmail.com>. Printing is for personal, private use only. No part of this book may be reproduced or transmitted without publisher's prior permission. Violators will be prosecuted. Richard A. McGowan, Boston College Christy McLendon, University of New Orleans John M. Miller, Sam Houston State University Robert Mogull, California State University–Sacramento Jason Molitierno, Sacred Heart University Daniel Monchuck, University of Southern Mississippi Tariq Mughal, University of Utah Patricia Mullins, University of Wisconsin–Madison Thomas Naugler, Johns Hopkins University Quinton J. Nottingham, Virginia Tech University Ceyhun Ozgur, Valparaiso University Linda M. Penas, University of California–Riverside Cathy Poliak, University of Wisconsin–Milwaukee Michael D. Polomsky, Cleveland State University Robert S. Pred, Temple University Sunil Ramlall, University of St. Thomas xvi xvii Steven Rein, California Polytechnic State University Donna Retzlaff-Roberts, University of South Alabama Essentials of Business Statistics, 4th Edition Page 25 of 32 PRINTED BY: Lucille McElroy <lucille.mcelroy@gmail.com>. Printing is for personal, private use only. No part of this book may be reproduced or transmitted without publisher's prior permission. Violators will be prosecuted. Donna Retzlaff-Roberts, University of South Alabama Peter Royce, University of New Hampshire Fatollah Salimian, Salisbury University Yvonne Sandoval, Pima Community College Sunil Sapra, California State University–Los Angeles Patrick J. Schur, Miami University William L. Seaver, University of Tennessee Kevin Shanahan, University of Texas–Tyler Arkudy Shemyakin, University of St. Thomas Charlie Shi, Daiblo Valley College Joyce Shotick, Bradley University Plamen Simeonov, University of Houston Downtown Bob Smidt, California Polytechnic State University Rafael Solis, California State University–Fresno Toni M. Somers, Wayne State University Ronald L. Spicer, Colorado Technical University–Sioux Falls Mitchell Spiegel, Johns Hopkins University Timothy Staley, Keller Graduate School of Management Essentials of Business Statistics, 4th Edition Page 26 of 32 PRINTED BY: Lucille McElroy <lucille.mcelroy@gmail.com>. Printing is for personal, private use only. No part of this book may be reproduced or transmitted without publisher's prior permission. Violators will be prosecuted. Timothy Staley, Keller Graduate School of Management David Stoffer, University of Pittsburgh Cliff Stone, Ball State University Courtney Sykes, Colorado State University Bedassa Tadesse, University of Minnesota–Duluth Stanley Taylor, California State University–Sacramento Patrick Thompson, University of Florida Emmanuelle Vaast, Long Island University–Brooklyn Ed Wallace, Malcolm X College Bin Wang, Saint Edwards University Allen Webster, Bradley University Blake Whitten, University of Iowa Susan Wolcott-Hanes, Binghamton University Mustafa Yilmaz, Northeastern University Gary Yoshimoto, Saint Cloud State University William F. Younkin, Miami University Xiaowei Zhu, University of Wisconsin–Milwaukee Essentials of Business Statistics, 4th Edition Page 27 of 32 PRINTED BY: Lucille McElroy <lucille.mcelroy@gmail.com>. Printing is for personal, private use only. No part of this book may be reproduced or transmitted without publisher's prior permission. Violators will be prosecuted. Xiaowei Zhu, University of Wisconsin–Milwaukee We also wish to thank the error checkers, Lou Patille, Colorado Heights University, and Peter Royce, University of New Hampshire, who were very helpful. Most importantly, we wish to thank our families for their acceptance, unconditional love, and support. DEDICATION Bruce L. Bowerman To my wife, children, sister, and other family members: Drena Michael, Jinda, Benjamin, and Lex Asa, Nicole, and Laine Susan Barney, Fiona, and Radeesa Daphne, Chloe, and Edgar Gwyneth and Tony Callie, Bobby, Marmalade, Randy, and Penney Clarence, Quincy, and Teddy Richard T. O’Connell To my children: Christopher and Bradley J. B. Orris To my children: Amy and Bradley Emily S. Murphree Essentials of Business Statistics, 4th Edition Page 28 of 32 PRINTED BY: Lucille McElroy <lucille.mcelroy@gmail.com>. Printing is for personal, private use only. No part of this book may be reproduced or transmitted without publisher's prior permission. Violators will be prosecuted. Emily S. Murphree To Kevin and the Math Ladies xvii xviii Chapter-by-Chapter Revisions for 4/e Chapter 1 • Chapter is totally rewritten. • New example involving home sales illustrating the value of data. • 7 new or rewritten exercises. Chapter 2 • Rewritten/reorganized example describing Jeep purchasing patterns. • Additional discussion of histograms. • Revised instructions for creating bar charts and pie charts in Excel. Chapter 3 • Slightly shortened discussions of central tendency and variation. Chapter 4 • AccuRatings case removed and replaced with simpler examples, including the song rating case. • Optional section on counting rules added to the chapter. • 11 new exercises added. Chapter 5 • Optional section on the Hypergeometric distribution added to the chapter. • 7 new exercises added. Chapter 6 • Rewritten introduction to continuous probability distributions. • Rewritten explanation of the exponential distribution. Essentials of Business Statistics, 4th Edition Page 29 of 32 PRINTED BY: Lucille McElroy <lucille.mcelroy@gmail.com>. Printing is for personal, private use only. No part of this book may be reproduced or transmitted without publisher's prior permission. Violators will be prosecuted. • Rewritten explanation of the exponential distribution. Chapter 7 • New discussion of random sampling. • Rewritten discussion of the sampling distribution of the sample mean. • New example of the sampling distribution of the sample mean employing the car mileage case. • New optional section on stratified random, cluster, and systematic sampling. • New optional section about surveys and errors in survey sampling. • 20 new exercises—5 involving the game show case Chapter 8 • Rewritten discussion of z-based confidence intervals for a population mean when sigma is known (including a step-by-step approach and two revised illustrative figures). • 8 new marginal figures that supplement examples of calculating confidence intervals. • 4 new exercises. Chapter 9 • Revised explanation of the null and alternative hypotheses. • Revised step-by-step procedure for performing a hypothesis test. • New hypothesis-testing summary boxes using innovative graphics. • New debt-to-equity ratio case. • Revised electronic article surveillance case. • 15 new/revised exercises. Chapter 10 • Proceeds directly to comparing two population means for the variance-unknown case. • 10 new marginal figures that supplement examples demonstrating two sample confidence intervals and hypothesis tests. Essentials of Business Statistics, 4th Edition Page 30 of 32 PRINTED BY: Lucille McElroy <lucille.mcelroy@gmail.com>. Printing is for personal, private use only. No part of this book may be reproduced or transmitted without publisher's prior permission. Violators will be prosecuted. intervals and hypothesis tests. Chapter 11 • Revised and shortened discussions of one-way ANOVA and the randomized block design. • New section on two-way ANOVA. • Substantial number of new Excel and MINITAB outputs. • 4 new exercises. Chapter 12 • No significant changes. Chapter 13 • Tasty Sub Shop case replaces the fuel consumption case as the primary example. • Explanation of the simple linear regression model completely rewritten in the context of the Tasty Sub Shop case. • Chapter substantially rewritten in the context of the Tasty Sub Shop case. • Durbin–Watson test added. • 9 new exercises (7 of these in the context of the fuel consumption case). Chapter 14 • Tasty Sub Shop case replaces the fuel consumption case as the primary example. • Explanation of the multiple regression model substantially rewritten in the context of the Tasty Sub Shop case. • Chapter substantially rewritten in the context of the Tasty Sub Shop case. • New section on using squared and interaction variables. • Discussions of model building slightly expanded (stepwise regression and partial F-test added.) • Discussion of residual analysis slightly expanded (outlier analysis added). • 8 new exercises (4 of these in the context of the fuel consumption case). Essentials of Business Statistics, 4th Edition Page 31 of 32 PRINTED BY: Lucille McElroy <lucille.mcelroy@gmail.com>. Printing is for personal, private use only. No part of this book may be reproduced or transmitted without publisher's prior permission. Violators will be prosecuted. • 8 new exercises (4 of these in the context of the fuel consumption case). Additions to website Appendix Properties of the Mean and the Variance of a Random B: Variable, and the Covariance ^ Appendix Derivations of the Mean and Variance of _¯ x̄ and _p C: Appendix Confidence Intervals for Parameters of Finite D: Populations Appendix Logistic Regression E: xviii Essentials of Business Statistics, 4th Edition Page 32 of 32


